Geoscience Reference
In-Depth Information
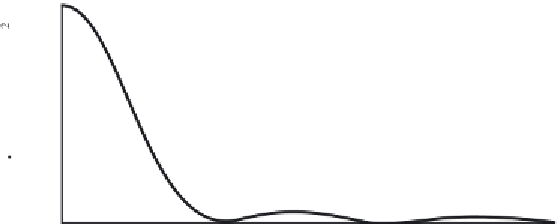
Figure 16.3 The spectral transfer function of line averaging of a scalar field.
Thus we have an expression for the effect of sensor-path averaging on the Fourier-
Stieltjes coefficients of the measured scalar:
sin
(
κ
·
L
/
2
)
dZ
m
(
κ
,
L
)
=
dZ(
κ
).
(16.51)
κ
·
L
/
2
This quantifies how this path averaging removes Fourier components of the
c
field
of wavenumber in the path direction much greater than 1
/L
, while not affecting
those of wavenumber components perpendicular to the path.
Since the scalar spectrum and its measured form are
φ
m
(
κ
)d
κ
=
dZ
m
(
κ
)dZ
m
∗
(
κ
),
φ(
κ
)d
κ
=
dZ(
κ
)dZ
∗
(
κ
),
(16.52)
it follows that the measured spectrum is
sin
2
(
κ
·
L
/
2
)
φ
m
(
κ
)
=
φ(
κ
)
=
T(
κ
,
L
)φ(
κ
),
(16.53)
L
/
2
)
2
(
κ
·
with
T(
κ
,
L
)
the spectral transfer function of line averaging. It is shown in
To determine the effect of path averaging on
F
1m
(κ
1
)
, the one-dimensional
streamwise wavenumber spectrum that we calculate from a time series measured
at a point using Taylor's hypothesis, we integrate over two wavenumbers:
∞
F
1m
(κ
1
)
φ
m
(
κ
)dκ
2
dκ
3
=
−∞
(16.54)
∞
φ(
κ
)
sin
2
(
κ
·
L
/
2
)
=
dκ
2
dκ
3
.
L
/
2
)
2
(
κ
·
−∞