Geoscience Reference
In-Depth Information
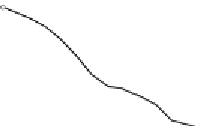
Figure 12.2 Time histories of 1-m temperature, friction velocity
u
, and surface
∗
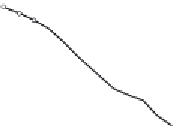
Figure 12.3 The late-afternoon decay of the friction velocity
u
in Run 2 of the
1973 Minnesota experiment. The solid line is the prediction of a second-order-
closure model. From
Wyngaard
(
1975
).
∗
mean rate of energy loss through viscous dissipation is balanced by their mean
rate of gain through the Kolmogorov energy cascade
(Chapter 6)
. If the rate of
viscous dissipation were larger than the cascade rate, the kinetic energy of the
dissipative eddies would decrease, decreasing the dissipation rate - and vice versa.