Geoscience Reference
In-Depth Information
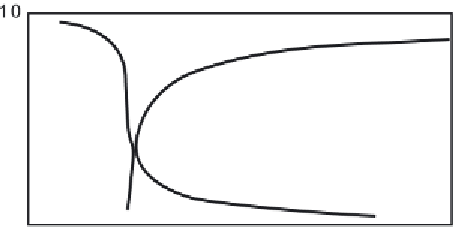
Figure 11.12 LES calculations of the dimensionless mean-gradient functions
g
b
and
g
t
defined in
Eq. (11.22)
.From
Moeng and Wyngaard
(
1984
).
11.3.1.1 Early LES results
Moeng and Wyngaard
(
1984
,
1986a
,
1986b
) used LES with 40
3
grid points to sim-
ulate the diffusion of passive, conserved “dyes” in a CBL with
10. A
blue dye was emitted continuously from the surface; in quasi-steady state it expe-
rienced both bottom-up and top-down diffusion. A red dye continuously entrained
into the CBL from above experienced only top-down diffusion. The function
g
t
,
Eq. (11.22)
, was determined directly from the red-dye field:
−
z
i
/L
w
∗
z
i
cw
1
∂C
t
g
t
=−
∂z
.
(11.23)
From the decomposition
C
=
C
b
+
C
t
and the definitions
(11.22)
of the gradient
functions we can write
∂C
∂z
+
w
∗
z
i
g
t
.
w
∗
z
i
cw
0
cw
1
g
b
=−
(11.24)
which with
g
t
now known allowed
g
b
to be evaluated from the statistics of the blue
dye field.
The resulting dimensionless mean-gradient functions
g
b
and
g
t
are shown in
0
.
6
z
i
is caused by a sign change in the
mean gradient
∂C
b
/∂z
; since the bottom-up flux is nonzero there, this implies a
singularity in the bottom-up eddy diffusivity
K
b
at that point.
K
t
is well behaved.
Thus the eddy diffusivities for the two processes are indeed not symmetric.
Based on LES studies
Patton
et al
.
(
2003
) proposed modified forms of
g
t
and
g
b
over a plant canopy.
Wang
et al
.
(
2007
) have attempted to determine them from long-
term, well-calibrated, point measurements of carbon dioxide mixing ratio over a