Geoscience Reference
In-Depth Information
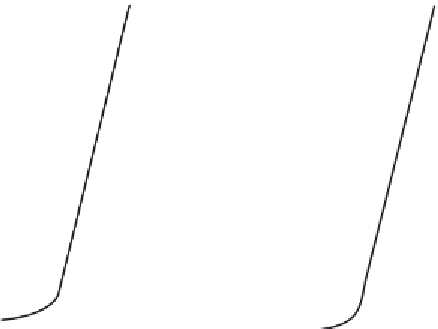
Figure 10.3 The M-O functions for mean wind shear (left) and mean potential
temperature gradient (right),
Eq. (10.12)
, from the 1968 Kansas experiment. From
Businger
et al
.(
1971
).
The von Kármán constant
k
was introduced in the early twentieth century to scale
the friction velocity in the fully turbulent region near a wall:
/ρ)
1
/
2
z∂U/∂z
(
|
τ
0
|
u
∗
z∂U/∂z
.
≡
=
k
(10.13)
The M-O function for mean wind shear,
Eq. (10.12)
, is defined with
k
to make
its value in neutral conditions 1.0:
φ
m
(
0
)
=
The Kansas experiments were among the first in which the mean wind and tem-
perature profiles and their turbulent fluxes were measured in the surface layer.
collapse of data taken over several weeks and a wide range of stability conditions.
Hogstrom
(
1988
) proposed that the underlying cause of the substantial variations
in the M-O functions
φ
m
and
φ
h
measured in numerous surface-layer experi-
ments was probe-induced flow distortion
(Chapter 16)
. He presented results from a
surface-layer experiment in which its effects were removed and other measurement
errors minimized. He suggested the following forms:
4
.
8
L
,
7
.
8
L
;
stable:
φ
m
=
1
.
0
+
φ
h
=
1
.
0
+
(10.14)
1
−
1
/
4
1
−
1
/
2
19
.
3
z
L
12
z
L
unstable:
φ
m
=
−
,φ
h
=
−
.