Geoscience Reference
In-Depth Information
h
r
f
u
ave
D
n
Re=
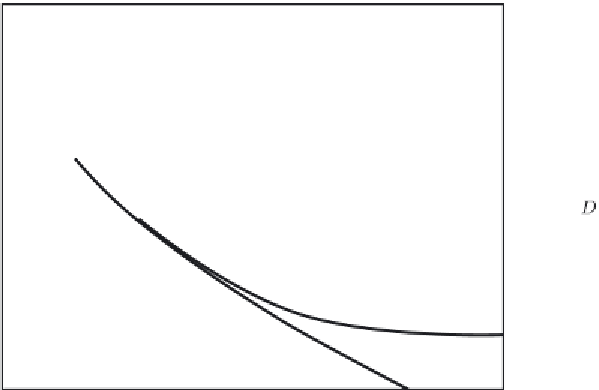
Figure 1.2 The
Moody chart
, which shows the behavior of the Darcy friction factor
f
,
Eq. (1.5)
, in a circular pipe. In laminar flow
f
Re
−
1
,
Eq. (1.6)
;
f
jumps to
∝
larger values with the transition to turbulence at
Re
2000, and in the region of
equilibrium turbulence past the critical zone
f
depends also on the wall-roughness
height
h
r
relative to
D.
Adapted from
Moody
(
1944
).
1.3 Turbulence and surface fluxes
An early motivation for the study of turbulence was to understand how it makes
the fluxes of momentum, heat, and mass at a solid surface much larger than in the
laminar case. This has important applications to both geophysical and engineering
flows.
Fluid flowing through a long circular pipe becomes turbulent at some point
downstream if the Reynolds number
Re
u
ave
D/ν
(
u
ave
is the velocity aver-
aged over the pipe cross section and
D
is the pipe diameter) exceeds about
2000. This
transition to turbulence
, as it is called, is marked by a jump in the
shear stress (which is also interpretable as a momentum flux,
Section 1.5
)atthe
wall
(Figure 1.2)
.
There is a corresponding jump in the required pumping power
(Problem 1.1)
.
To understand these abrupt changes at transition we need some background on
pipe flow. In the steady, laminar case its velocity profile is parabolic
(Problem 1.1)
,
u(r)
=
u
max
1
=
R
2
,
r
2
−
(1.1)