Geoscience Reference
In-Depth Information
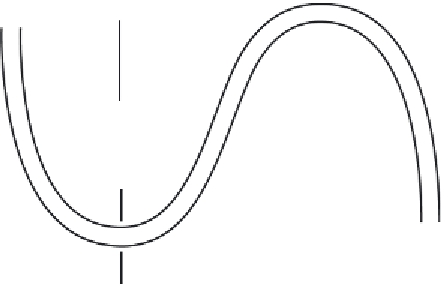
Figure 7.4 The
Tennekes
(
1968
) model of the dissipative regions in turbulence.
Based on the
Batchelor and Townsend
(
1949
) study,
Corrsin
(
1962
) hypoth-
esized that at large enough
R
t
a turbulence field “has a binary character, with
relatively large regions of nearly potential flow with negligible fine structure, and
relatively small regions of intense fine structure where the viscous dissipation
occurs.” Corrsin suggested that these dissipative regions were thin sheets and made
a simple model of the resulting intermittency statistics.
Tennekes
(
1968
) argued that
Corrsin's model was internally inconsistent and suggested instead that the regions
of dissipative activity (
Figure 7.4
)
are tubes of diameter
η
and length
λ
, the Taylor
microscale (
Section 1.9
); he hypothesized there was of order one of these tubes per
volume
λ
3
.
Current thinking on dissipative structure includes sheets distributed in more
complex ways, sheets with wrinkles of many length scales, and a mixture of
such sheets and tubes. Here we'll pursue the implications of Tennekes' tube
model because it allows some simple but illuminating estimates of fine-structure
statistics.
We begin with the relation
u
3
/
νu
2
/λ
2
,
which implies that
/λ
∼
∼
∼
R
1
/
2
∼
R
λ
.
The volume fraction occupied by the dissipative regions is therefore
t
η
2
λ
λ
3
η
2
λ
2
η
2
2
R
t
∼
R
−
1
/
2
R
−
1
∼
∼
∼
∼
volume fraction
,
(7.28)
t
λ
using
Eq. (1.35)
. Themodel predicts that the dissipative regions occupy a decreasing
volume fraction of the turbulent fluid as
R
t
increases.
The model also predicts that the velocity derivative signal grows in spikiness as
R
t
increases. The highest-amplitude velocity derivatives are predicted to be of order