Geoscience Reference
In-Depth Information
7.3.2 Structure of the dissipative regions
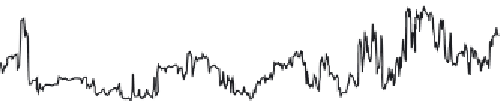
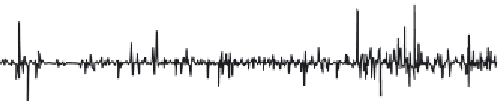
The “spiky” appearance of turbulent velocity and scalar derivative signals,
Figure 7.3
,
indicates that their amplitudes alternate between zero and very large
values. As discussed in
Part III
, one measure of the “spikiness” of a signal is its
flatness factor
F
. For turbulent velocity or scalar signals
F
is typically near the
Gaussian value of 3, but
F
for their derivative tends to be larger. Early laboratory
measurements at low
R
t
showed that for a given derivative
F
did appear to approach
the
R
t
-independence predicted by Kolmogorov's universal equilibrium hypothesis
(
Batchelor
,
1960
).
By the late 1960s measurements at much larger
R
t
made it evident that the
flatness factors of velocity and temperature derivatives increase continuously with
R
t
. A physical interpretation is that unlike the energy-containing eddies, dissipative
eddies are not uniformly distributed in space at a given time; instead they tend to be
concentrated in spatially localized, transient “bursts” in a way that becomes more
prominent as
R
t
increases. This was named
dissipation intermittency
.
Figure 7.3 Measured fluctuating signals of (from top) streamwise velocity, tem-
perature, and their time derivatives in a laboratory turbulent flow with a transverse
mean temperature gradient. Through Taylor's hypothesis the time derivative is
interpreted as proportional to the streamwise derivative. From
Warhaft
(
2000
).
Reprinted, with permission, from
Annual Review of Fluid Mechanics
,
32
, ©2000