Geoscience Reference
In-Depth Information
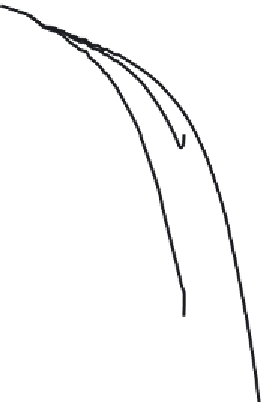
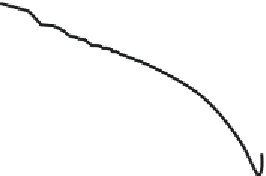
Figure 7.1 The three-dimensional scalar spectrum calculated through direct
numerical simulation at four values of the Schmidt number
Sc
. It is dimensional;
the units are scalar variance/wavenumber.
,
Sc
=1/8;
,
Sc
=1;
◦
,
Sc
=4; ,
were generated with 256
3
grid points;
Sc
= 64. The data for curves
and
used 2048
3
.Curve
◦
shows evidence of the exponential falloff in the
inertial-diffusive range,
Eq. (7.16)
, predicted by
Corrsin
(
1964
). Curve shows
the
κ
−
1
viscous-convective range of
Eq. (7.17)
predicted by
Batchelor
(
1959
).
Data courtesy D. Donzis and P. K. Yeung; see
Donzis
(
2007
).
and
much larger, but viscous, eddies, but is not affected by its own molecular diffusiv-
ity.
Batchelor
(
1959
) hypothesized that here
E
c
E
c
(κ, χ
c
,(/ν)
1
/
2
)
.Thenon
=
dimensional grounds this yields
χ
c
(/ν)
−
1
/
2
κ
−
1
,
E
c
∼
(7.17)
which is observed in experiments (
Gibson and Schwartz
,
1963
), and in direct
numerical simulations
(
Figure 7.1
)
.
Batchelor
(
1959
) hypothesized that in this limit the diffusive cutoff scale in the
scalar spectrum, now known as the Batchelor microscale
η
B
, is determined by
γ
and the strain rate
(/ν)
1
/
2
. This yields
γ
(/ν)
1
/
2
1
/
2
∼
η
γ
ν
1
/
2
η
B
=
f
γ, (/ν)
1
/
2
∼
.
(7.18)