Information Technology Reference
In-Depth Information
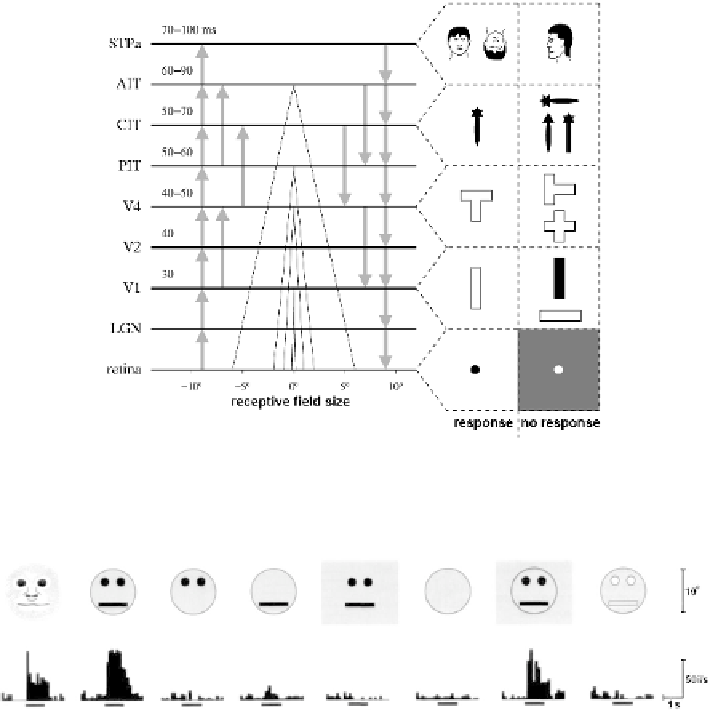
Fig. 2.5.
Hierarchical structure of the ventral visual pathway. Visual stimuli are represented
at different degrees of abstraction. As one ascends towards the top of the hierarchy recep-
tive field size and feature complexity increase while variance to transformations and spatial
resolution decrease (adapted from [243]).
Fig. 2.6.
Face selectivity of IT cells. The cell responds to faces and face-like figures, but not
to face parts or inverted faces (adapted from [117].
2.2 Feature Maps
The visual areas are not retinotopic arrays of identical feature detectors, but they are
covered by regular functional modules, called hypercolumns in V1. Such a hyper-
column represents the properties of one region of the visual field.
For instance, within every 1mm
2
patch in area V1, a complete set of local orien-
tations is represented, as illustrated in Figure 2.7. Neurons that share the same ori-
entation and have concentric receptive fields are grouped vertically into a column.
Adjacent columns represent similar orientations. They are arranged around singular
points, called pinwheels, where all orientations are accessible in close proximity.
In addition to the orientation map, V1 is also covered by a regular ocular domi-
nance pattern. Stripes that receive input from the right and the left eye alternate. This
makes interaction between the information from both eyes possible, e.g. to extract
Search WWH ::

Custom Search