Information Technology Reference
In-Depth Information
degraded
adaptive
iterative
degraded
original
thresholding
binarization
1
rejected
11 (6%)
11 (6%)
average
recognition
error
0.176
0.094
0.75
0.5
original
adaptive
iterative
thresholding
binarization
rejected
0
0
0.25
average
recognition
error
0.0203
0.0193
0
0
0.25
0.5
0.75
1
(a)
(b)
Fig. 8.18.
Data Matrix test set recognition: (a) recognition error of iterative binarization ver-
sus adaptive thresholding; (b) average recognition errors.
iterative binarization recognition error
(a) (b) (c)
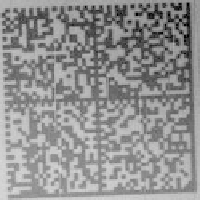
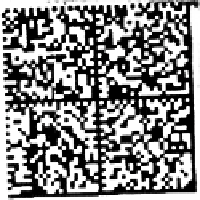
Fig. 8.19.
Most difficult Data Matrix code. Shown is the only test example that could neither
be recognized using adaptive thresholding nor using iterative binarization: (a) degraded input
image; (b) output of adaptive thresholding; (c) output of iterative binarization.
methods is not much different for the original images since the network has been
trained to resemble the behavior of adaptive thresholding for such images.
In contrast, for most degraded images, the recognition error is lower when using
the iterative binarization method than when adaptive thresholding is used. The aver-
age recognition error for iterative binarization (0.094) is much lower than the one of
adaptive thresholding (0.176), as summarized in Fig. 8.18(b). Thus, the use of itera-
tive binarization substantially lowers the need for error correction in the recognition
engine.
Further, it can be seen in the Figure 8.18(a) that most of the 11 test examples
which could not be recognized when using one method could be recognized when
using the other method. Only one test example (0.55%), shown in Figure 8.19, was
rejected by the recognition engine in both cases. It is difficult due to its rotation,
the non-uniform background, and the large number of vertical lines. Hence, the
combination of both methods could lower the rejection rate of the system by an
order of magnitude, compared to each method alone.


Search WWH ::

Custom Search