Information Technology Reference
In-Depth Information
(a) (b) (c)
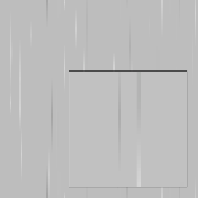
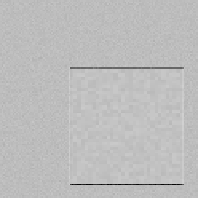
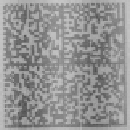
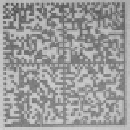
Fig. 8.8.
Image degradation: (a) vertical light and dark lines; (b) background level; (c) pixel
noise.
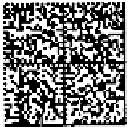
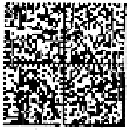
(a)
(b)
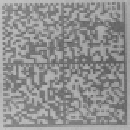
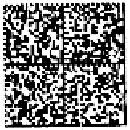
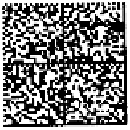
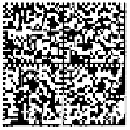
Fig. 8.9.
Degraded images (originals in Fig. 8.3(a)): (a) with random degradations; (b) output
of the adaptive thresholding for the degraded images.
a length between 21 and 121 pixels. The intensity of a line interpolates linearly
between the original gray value at the ends, and the estimated background or fore-
ground intensity in the center, as can be seen in Fig. 8.8(a). The background level,
shown in Part (b) of the figure, is computed as sum of a horizontal and a vertical si-
nusoid. Their random amplitudes can reach the difference between the background
and the foreground intensity. The phases are distributed uniformly and the wave-
lengths are chosen uniformly between 63 and 1420 pixels. Image contrast is low-
ered to
[0
.
1
,
0
.
6]
times the original level. The amplitude of the uniform pixel noise
depends linearly on contrast and can reach the value of 24. Fig. 8.8(c) shows an
example of such pixel noise.
In Figure 8.9(a) the degraded versions of the images from Fig. 8.3(a) are shown.
Part (b) of the figure displays the output of the adaptive thresholding for the de-
graded images. It can be seen that the outputs are of much lower quality than the
ones in Fig. 8.6(a) which were produced from the undegraded images. In particular,
the vertical lines cannot be removed by a pixel-based method.


Search WWH ::

Custom Search