Database Reference
In-Depth Information
Global Snapshot for Time t
1
Global Snapshot for Time t
2
NPP
NPP
Pressure
.
.
.
Pressure
Precipitation
Precipitation
SST
SST
Latitude
grid cell
zone
Longitude
Time
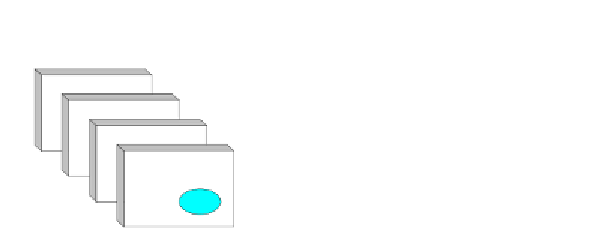
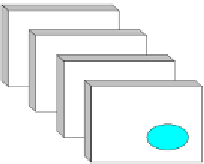
Figure 15.1.
Schematic of multiple grid-based remote sensing datasets such as Sea
Surface Temperature (SST), Precipitation, Pressure, and Net Primary Productivity
(NPP), represented on a spatial grid, where each grid cell covers a range of latitude
and longitude values, and varying with time
2.2 Reanalysis Data
When observational sensor datasets are scantily available or are irreg-
ularly placed rendering simple interpolation methods functionless, com-
prehensive physical models have to be used in conjunction with observed
sensor recordings to calculate possible values over large areas with miss-
ing values or data of poor quality. The analysis and interpolation of ob-
served sensor recordings requires physical knowledge of involved natural
processes to fill in missing or poor quality values. For atmospheric and
oceanic data, this knowledge is provided by general circulation models
[52], e.g. the Goddard Earth Observing System Data Assimilation Sys-
tem Version 5 (GEOS-5) [33]. After generating analysis fields at each
time by assimilating observations into the physical model, the model
verifies the consistency of the data products over time and makes ap-
propriate adjustments to the data by balancing between observational
uncertainty and acceptable noise in the system. This step is referred to
as
reanalysis
. Multiple
reanalysis
products are currently available, each
with different input sources and underlying physical model [64].
Table 15.1
lists commonly used datasets in earth science research.
Since earth science datasets exhibit unique properties distinguishing
them from sensor datasets used in other domains, we discuss key data-
centric issues and challenges in analyzing earth science datasets in the
subsequent section.