Database Reference
In-Depth Information
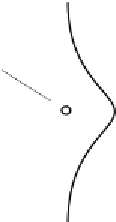
probability
distribution inferred
anomaly
v
7j
expected value
v
6j
ȝ
v
5j
v
6j
v
2j
v
7j
v
6j
v
3j
3ı
3ı
sliding window
time
t
i
= 6
t
i
= 7
Figure 2.7.
An example of data cleaning based on a probabilistic model.
common probabilistic models to compute inferred values corresponding
to raw sensor values. The Kalman filter is a stochastic and recursive data
filtering algorithm that models the raw sensor value
v
ij
as a function of
its previous value (or state)
v
(
i−
1)
j
as follows:
v
ij
=
Av
(
i−
1)
j
+
Bu
i
+
w
i
,
where
A
and
B
are matrices defining the state transition from time
t
i−
1
to time
t
i
,
u
i
is the time-varying input at time
t
i
,and
w
i
is the process
noise drawn from a zero mean multi-variate Gaussian distribution. In
[63], the Kalman filter is used for detecting erroneous values, as well as
inter/extrapolating missing sensor values. Jain
et al.
[29] also use the
Kalman filter for filtering possible dirty values.
Similarly, Elnahrawy and Nath [21] proposed to use Bayes' theorem to
estimate a probability distribution
P
ij
at time
t
i
from raw sensor values
v
ij
, and associate them with an error model, typically a normal distri-
bution. Built on the same principle, a neuro-fuzzy regression model [52]
and a belief propagation model based on Markov chains [13] were used
to identify anomalies. Tran
et al.
[65] propose a method to infer missing
or erroneous values in RFID data. All the techniques for inferring sen-
sor values also enable quality-aware processing of sensor data streams
[36, 37], since inferred sensor values can serve as the bases for indicating
the quality or precision of the raw sensor values.
3.2.3 Outlier Detection Models.
An
outlier
is a sensor value
that largely deviates from the other sensor values. Obviously, outlier
detection is closely related to the process of sensor data cleaning. The
outlier-detection techniques are well-categorized in the survey studies of
[51, 8].