Database Reference
In-Depth Information
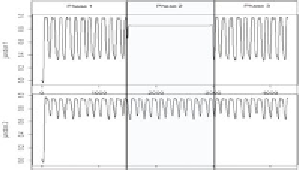
(a) Sensor measurements
(b) Hidden variables
Figure 5.1.
Illustration of problem. Sensors measure chlorine in drinking water and
show a daily, near sinusoidal periodicity during phases 1 and 3. During phase 2, some
of the sensors are “stuck” due to a major leak. The extra hidden variable introduced
during phase 2 captures the presence of a new trend. SPIRIT can also tell us which
sensors participate in the new, “abnormal” trend (e.g., close to a construction site).
In phase 3, everything returns to normal.
We describe a motivating scenario, to illustrate the problem we want
to solve. Consider a large number of sensors measuring chlorine concen-
tration in a drinkable water distribution network (see
Figure 5.1
, showing
15 days worth of data). Every five minutes, each sensor sends its mea-
surement to a central node, which monitors and analyzes the streams in
real time.
The patterns in chlorine concentration levels normally arise from wa-
ter demand. If water is not refreshed in the pipes, existing chlorine
reacts with pipe walls and micro-organisms and its concentration drops.
However, if fresh water flows in at a particular location due to demand,
chlorine concentration rises again. The rise depends primarily on how
much chlorine is originally mixed at the reservoirs (and also, to a small
extent, on the distance to the closest reservoir—as the distance increases,
the peak concentration drops slightly, due to chemical reactions along
the way). Thus, since demand typically follows a periodic pattern, chlo-
rine concentration reflects that (see
Figure 5.1a
, bottom): it is high when
demand is high and vice versa.
Assume that at some point in time, there is a major leak at some pipe
in the network. Since fresh water flows in constantly (possibly mixed
with debris from the leak), chlorine concentration at the nodes near the
leak will be close to peak at all times.
Figure 5.1a
shows measurements collected from two nodes, one away
from the leak (bottom) and one close to the leak (top). At any time, a
human operator would like to know how many trends (or
hidden vari-
ables
) are in the data and ask queries about them. Each hidden variable
essentially corresponds to a group of correlated streams.


