Environmental Engineering Reference
In-Depth Information
10
8
6
4
2
0
-2
-4
-6
-8
-20
-15
-10
-5
0
5
10
15
20
SOL × 10
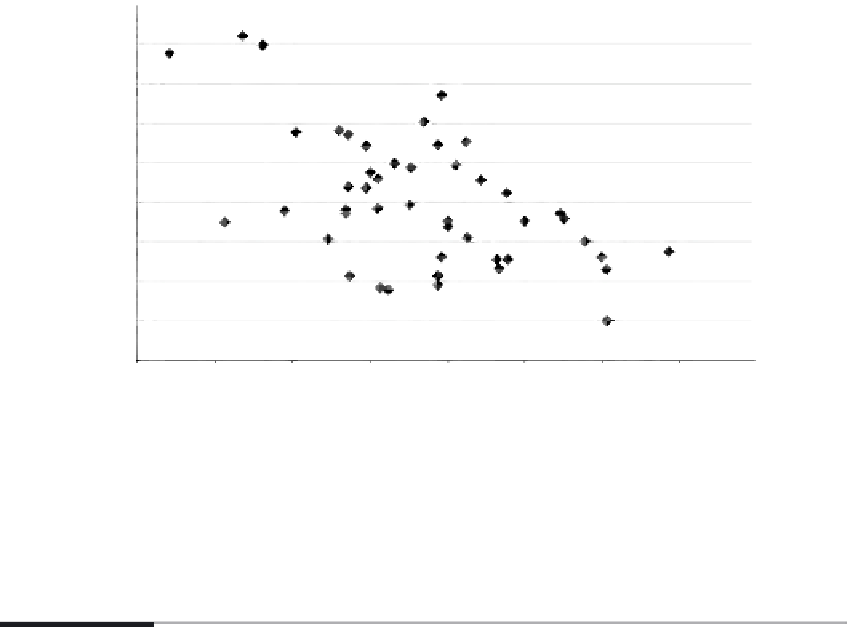
FIGURE 3.2
Precipitation anomaly for the central Arizona region (in inches for the water year—October for 1 year to
September of the next year) from mean values (1950-1995) versus the Southern Oscillation Index (normalized
pressure at Tahiti, central South Pacific Ocean minus Darwin, Australia × 10). Note inverse relation (negative
SOI means an El Nino and tendency toward more precipitation; positive SOI means La Nina and less precipita-
tion). R value is 0.272 and is significant at the 0.05 level of significance.
3.4 Regional to Local Scale
If we consider the whole contiguous desert Southwest as some uniform region and dismiss
the notion of variability and factors of climate that operate at the local scale for design-
ing and living with the desert, we would ignore sustainability-threatening variability
within the region. Much of this with-region variability is due to several factors: (1) eleva-
tion, slope, and aspect of terrain; (2) watershed variation, orientation of river channels, and
wind drainage paths; (3) kind of surfaces, soil, vegetation, heating and cooling rates over
these surfaces, and their impermeability to water; and (4) climate within and over the built
or human-impacted lands (e.g., urban, desert, agriculture) of the region as examples of
local factors. Each of these factors requires careful thought and analysis as to significance
for living in the desert.
There are four North American deserts to consider: (1) The Great Basin, (2) Sonoran,
(3) Mojave, and (4) Chihuahuan.
*
Different temperatures, elevations, and quantities of
precipitation occur among these deserts (Figures 3.3 through 3.5). Generally, the Great
Basin, centered over the state of Nevada, is considered a cold desert (winter temperatures
well below freezing), with snowfall totals ranging from 4 to 11 in. Austin (elevation 6661 ft,
latitude 39°30′N, longitude 117°5′W) and Las Vegas (elevation 2170 ft, latitude 36°5′N,
longitude 115°10′W) represent ranges of climate conditions in this desert region, with
even more variable conditions at higher elevations in mountain areas. Total precipitation
at Austin is 12.6 in. and Las Vegas is 4.2 in. Annual average maximum and minimum
temperatures are 60.9°F and 34.3°F at Austin and 80.0°F and 53.6°F at Las Vegas.
*
These deserts are also discussed from different perspectives in Chapters 1, 2, and 7.

Search WWH ::

Custom Search