Agriculture Reference
In-Depth Information
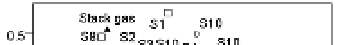
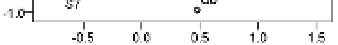
The PCA result of HxCDFs isomer profile is shown in Fig.10. Two principal components are
extracted from the analyzed 13 isomers. Although component 1 and component 2 can only
explain 32.72% of samples' information, while it still can give some useful information for
investigating the relation among soils and MWI emission by PCA of isomer profile. In
Fig.10, it is observed that 2007 soil spots locate in a large scale, apart from each other, and far
away fly ash and stack gas, which means significant difference between 2007 soils and MWI
emission. Other year soils have slight trend of assemblage together, meanwhile, become
closer to the location of fly ash and stack gas. The points of 2008 and 2010 survey soils are
closer to MWI than the sites of 2009 soils, and the group of 2010 survey soils has
comparatively closest relation with MWI emission in the PCA plot. This is in line with the
variation of PCDD/Fs concentration, and the HxCDF isomer profile also become more likely
with MWI emission with year's past.
Fig. 10. PCA plot of HxCDF isomers distribution.
4. Conclusion and future work
In the present study, it was observed that dioxin level varied in the analyzed four years,
generally, the average level increased after this MWI operation started, as long as just a
slight increase in the background samples. The most significant variation is detected in the
sites close to this plant, and accounting for the relation of variation and distance away the
stack, a limited region near MWI (approx. 500 m) is assumed to be under the influence of
PCDD/Fs emission from this MWI. By the PCA of PCDD/Fs homologue pattern and
HxCDF isomer profile, PCDD/Fs characteristic distribution in soil became more and more
similar with the character of MWI emission. The present PCDD/Fs concentration in this
region is in the normal level by the comparison with other studies over the worldwide. In