Agriculture Reference
In-Depth Information
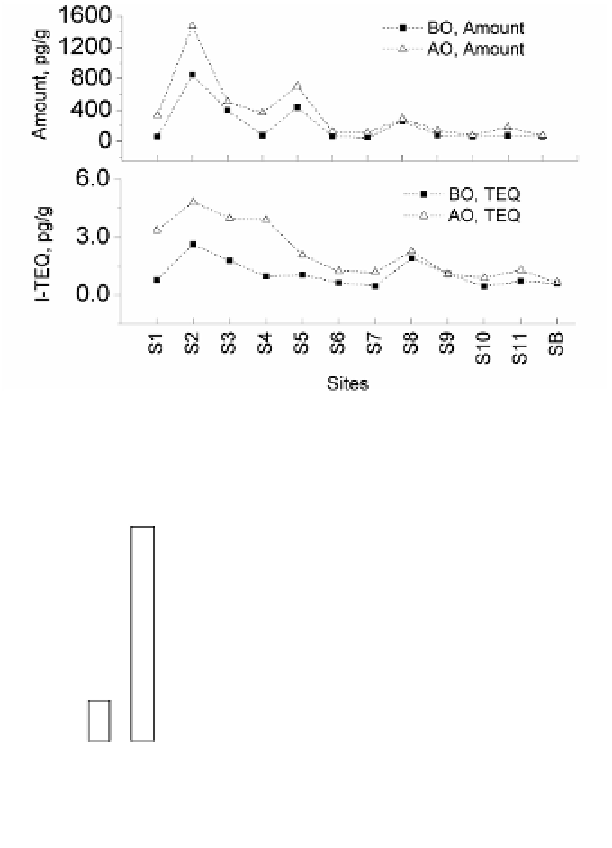
Fig. 5. Comparison of PCDD/Fs in soils collected before operation (BO, 2007) and after
operation (AO, average of 2008 to 2010).
14
12.24
12
10
7.36
7.1
8
6
4
4
3.01
2.83
2.34
2.11
2
1.27
1.3
1.2
2
0
Fig. 6. The average of PCDD/Fs level in soil around worldwide.
3.3 Analysis of PCDD/Fs homologue pattern
Jiménez et al. (1996) found a slight PCDD/Fs contamination in soil near a medical waste
incinerator in Madrid Spain, but did not clarify whether this plant was the only PCDD/Fs
source responsible for the contamination. Homologue pattern or specific congener/isomer is
defined as the fingerprint of PCDD/Fs. PCDD/Fs homologue distribution in soil, fly ash
and stack gas are present in Table 2 to 6. The average PCDD/Fs homologue pattern in
different surveys is present in Fig.7. Different PCDD/Fs sources have different fingerprint
(Alcock et al., 1999; Domingo et al., 2001). In generally, the ratio of PCDFs to PCDDs from
combustion processes is larger than 1, and a maximum weight distribution is PeCDF or
HxCDF (Huang & Buekens, 1995). OCDD predominates PCDD/Fs homologue in the soil
samples, which is consistent with other surveys. The deposition of OCDD on soil is easier
and OCDD has longer degradation half-life time (Sinkkonen & Paasivirta, 2000). In the stack
gas and fly ash, the dominant compound is HxCDF and PeCDF, and OCDD proportion is