Database Reference
In-Depth Information
10
0
D
1
Users
RW
10
-1
D
2
0.02
(
r
g
+
r
g
)
-
β
r
e
-
r
g
/
κ
0
10
-2
10
-3
0.01
10
-4
10
-5
0
10
-6
0 24487296
t
(h)
120 144 168 192 216 240
10
0
10
1
10
2
10
3
10
4
r
g
(km)
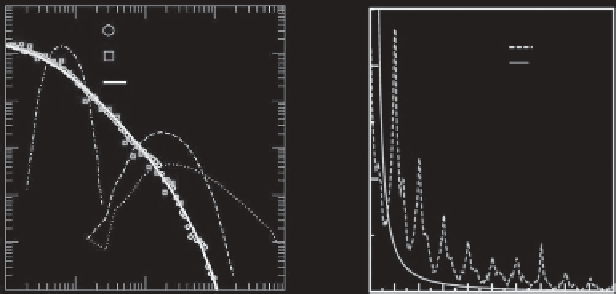
Figure 15.4 The distribution
P
(
r
g
) of the radius of gyration measured for the users. The
solid line represents a similar truncated power-law fit. The dotted, dashed, and dot-dashed
curves show
P
(
r
g
) obtained from random walk, pure, and truncated Levy flight models.
The picture on the right shows that the prominent peaks capture the tendency of humans to
return regularly to the locations they visited before, in contrast with the smooth asymptotic
behavior (solid line) predicted for random walks. Figure from
Gonzalez et al.
(
2008
).
from randomness emerge from other measures. The distribution
P
(
r
g
)ofradius
of gyration
r
g
, the characteristic distance traveled by a user when observed up
to time
t
, also follows a power law, in contrast with random walks (Figure
15.4
,
left). So, most people usually travel in close vicinity to their home locations,
while a few frequently make long journeys. Furthermore, the probability
F
pt
(
t
)
that a user returns to the position where he or she was first observed after
t
hours
shows several peaks at 24 hours, 48 hours, and 72 hours (Figure
15.4
, right),
capturing the recurrence and temporal periodicity inherent to human mobility.
The most important result was the finding that, after appropriate rescaling
aiming to remove the anisotropy and the
r
g
dependence, all individuals seem to
follow the same universal probability distribution
˜
(
x, y
) that an individual is in
a given position (
x,y
) (Figure
15.5
b). Individuals display significant regularity,
returning to a few highly frequented locations, such as home or work. This
regularity does not apply to the bank notes: a bill always follows the trajectory of
its current owner; that is, dollar bills diffuse, but humans do not. Song et al. 2010
extended the experiment to a larger data set and measured the distribution of the
visiting time (the interval
t
a user spends at one location). The resulting curve
is well approximated by a truncated power law with an exponent
β
=
0
.
8
±
0
.
1
and a cutoff of
t
=
17 hours, which the authors connected with the typical
awake period of humans. The number of distinct locations
S
(
t
) visited by humans
is sublinear in time, well approximated by
S
(
t
)
t
μ
with
μ
0
.
02, that
indicates a decreasing tendency of people to visit previously unvisited locations.
∼
=
0
.
6
±