Database Reference
In-Depth Information
(a)
(b)
(c)
(d) (e)
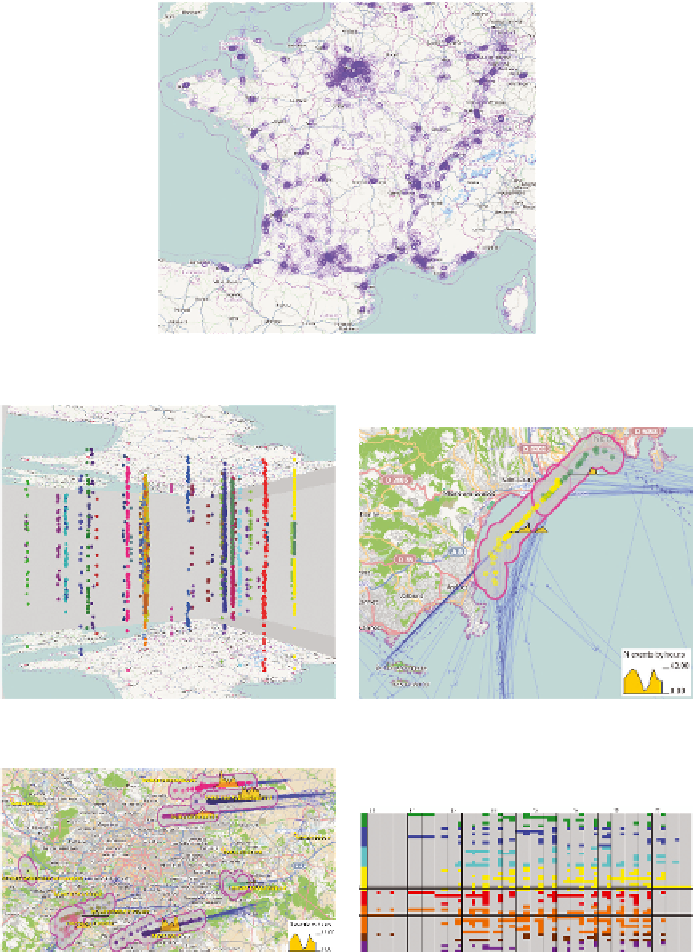
Plate 12.6 Event extraction results. (a) The positions of the landing events extracted from
the flight data are drawn with 50% opacity. (b) The space-time cube shows the landing
events clustered by spatial positions and directions. (c) The yellow and green dots represent
two SD-clusters of landings in the airport of Nice. The time diagrams show the dynamics
of the landings from two directions. (d) The time diagrams show the dynamics of landings
in the airports of Paris. (e) The flight distribution between the airports by hourly intervals.
Highlighted are rows for the connections Marseille-Paris (yellow) and Paris-Marseille
(orange).