Database Reference
In-Depth Information
(a)
(b)
(c)
(d)
N visits by hours
137.0
100
137
50
0.0
0.0
01;00
01;12
02;00
02;12
03;00
03;12
04;00
04;12
05;00
05;12
06;00
06;12
07;00
07;12
(e)
Time cluster=2: N v Time cluster=8: N v Time cluster=5: N v Time cluster=1: N v Time cluster=9: N v
100.
90.0
80.0
70.0
60.0
50.0
40.0
30.0
20.0
10.0
0.0
Time cluster=3: N v
Time cluster=10: N Time cluster=7: N v Time cluster=6: N v
Time cluster=4: N v
(f)
(g)
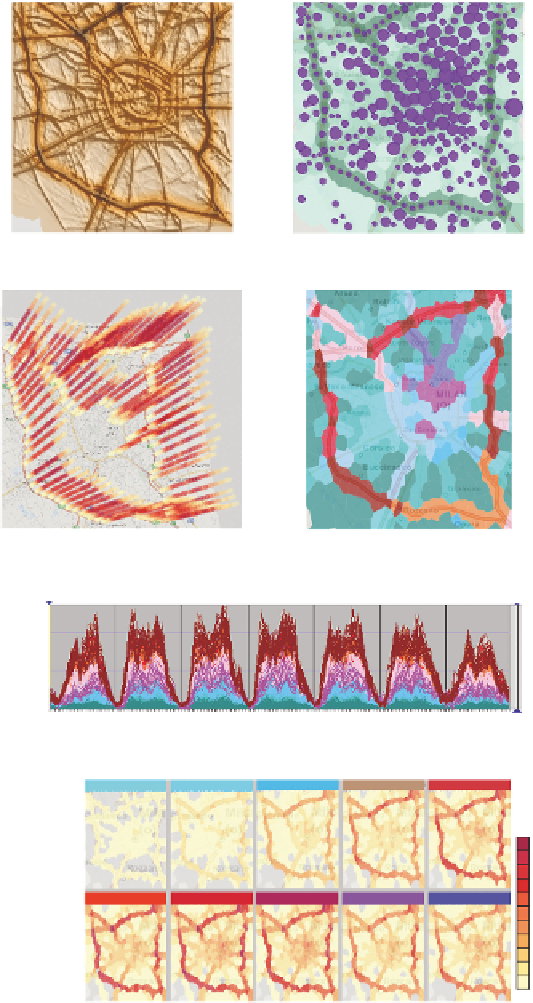
Plate 8.4 (a,b) Car tracks aggregated in a continuous density surface (a) and by discrete
grid cells (b). (c) STC shows the variation of car presence over a day in the most visited
cells. (d) The cells clustered by similarity of the presence time series shown on a time graph
in (e). (f) Hourly time intervals clustered by similarity of the spatial distributions of car
presence, which are summarized in (b).