Database Reference
In-Depth Information
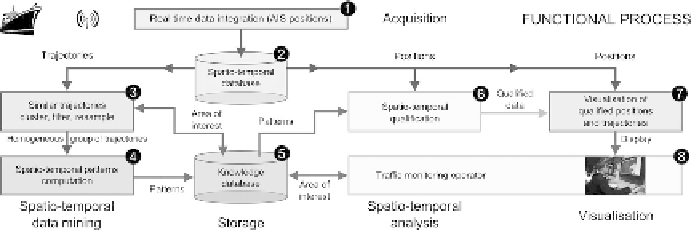
Figure 11.2 Data mining and trajectory qualification process.
The range covered by all VTS on shore is limited and coverage areas might
not overlap everywhere. In such a context, the observation of the maritime traffic
at a given time leads to a partial view due to space and time gaps. These received
positions will mostly not correspond to the selected times for snapshots analysis
(e.g., a ship communicated its position 10 seconds before the analysis time).
This implies one should consider time intervals and the definition of trajectories
for a successful analysis and understanding of the ships' behaviors. Let us
note that these large and variable gaps between two position reports will affect
significantly the way trajectories can be computed.
11.2 A Monitoring System Based on Data-Mining Processes
The increase of maritime location-based information brings opportunities for
knowledge discovery on movement behaviors at sea over a long period of time.
This section shows how maritime data can be processed and analyzed in order
to qualify a given position or trajectory with computed patterns. This process
allows one, for instance, to detect outliers including real-time traffic monitoring.
It is based on data-mining principles presented in other chapters, especially
Chapter
6
. The methodology postulates that
normal
moving objects following
a same itinerary at sea behave in a similar optimised way. Such a behavior
illustrated in Figure
11.1
helps to compute accurate trajectory patterns.
Figure
11.2
presents the functional process used to extract spatio-temporal
patterns from spatio-temporal databases and qualify ship positions and trajec-
tories. First, an acquisition step (Step 1 in Figure
11.2
) integrates AIS raw
data from several monitoring systems into a structured spatio-temporal database
(STDB). In this database, zones of interest (ZOI) define either an origin or a
destination of a trip. Each identified ZOI is associated with its surface and linked
to its neighbors (and stored in the spatio-temporal database). Then, trajectories
are clustered (Step 3) according to their itineraries in order to obtain homo-
geneous groups of trajectories (HGT). A statistical analysis of these clusters
gives the median trajectory of each cluster and spatio-temporal intervals around