Database Reference
In-Depth Information
(a)
(b)
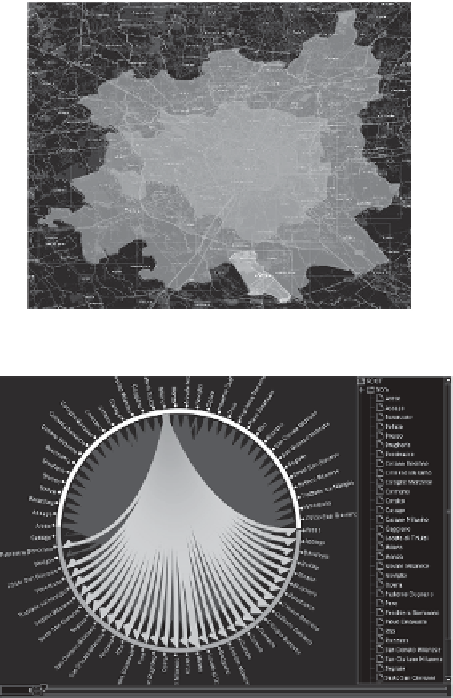
Figure 10.5 The resulting OD matrix model for Milano2007 on a specific weekday
(Wednesday, April 3rd). (a) The regions used as input for the model: the center region
contains the administrative borders of Milan and the adjacent cells represent neighbouring
cities; (b) The visual interface to browse the OD matrix: each region is represented with
a node, nodes are displayed in a circular layout. The arc connecting two nodes represents
the flow, i.e., the number of trips from the origin to the destination node; the arc width is
proportional to the flow. The analyst visually browses the OD matrix, either selecting some
specified origins and/or destinations or highlighting the main flows by setting a minimum
support threshold.
cluster are drawn with the same color. Figure
10.6
b shows how the most popular
clusters highlight the main routes used by drivers to leave the center toward the
northeast.
The frequent behaviors highlighted by the clustering process followed above
might in some cases be characteristic of some specific time period (for instance,