Database Reference
In-Depth Information
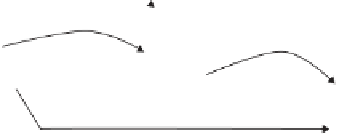
Temporal information
Area A
Δ
t
∈
[5, 8] minutes
Δ
t
∈
[30, 35] minutes
Area B
Area C
Spatial information
(a)
(b)
Figure 6.3 (a) Visual representation of a T-pattern and (b) sample result on a real data set.
support threshold
, corresponding to the minimum size of the population that
contributes to form the pattern (the parameter
m
for flocks); and a time tolerance
threshold
τ
, which determines the way transition times are aggregated: transition
times that differ less than
τ
will be considered
compatible
, and therefore can be
joined to form a common typical transition time.
Figure
6.3
a depicts an example of a T-Pattern on vehicle data describing the
movements of a fleet of trucks. The pattern shows that there exists a consistent
flow of vehicles from region A to region B, and then back to region C, close
to the origin. Also, the time taken to move from region A to region B (
t
1
in
the figure) is around ten times greater then the transition time from B to C.
That might suggest, for instance, that the first part of the pattern describes a set
of deliveries performed by the trucks, while the second part describes the fast
return to the base.
6.2.3 Not Using Time
In many cases it is interesting to understand if there are typical routes followed
by significant portions of the population, that is:
Are there groups of objects that perform a common route (or segment of route),
regardless of when and how fast they move?