Database Reference
In-Depth Information
Time
Profile
Cell
dateTime
...
profileID
gender
ageGroup
profession
maritalStatus
deviceType
...
cellNo
...
Calendar
GeoLocation
Day
District
date
week
isHoliday
...
name
population
area
...
AggTrajectories
presence
distance
sumDistance
duration
sumDuration
velocity
acceleration
crossX
crossY
crossT
Month
Zone
month
...
number
name
...
Year
year
...
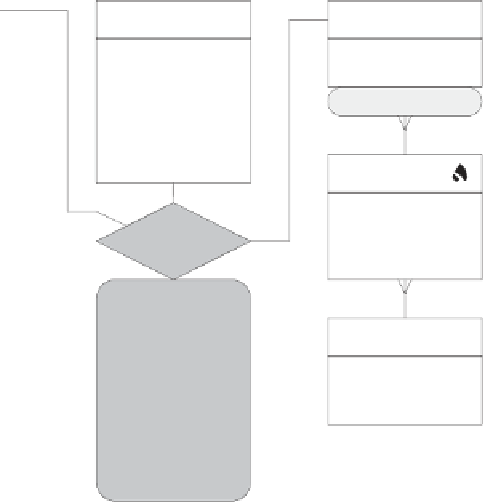
Figure 4.5 The GeoPKDD TDW in the MultiDim model.
table references the dimensions, and includes measures that provide indicators
about the trajectories in each element of the partition (e.g., number of trajectories,
total time spent in the cell or road segment, etc.). Finally, these aggregate data
are exploited using a Visual OLAP interface that allows multidimensional and
interactive analysis (covered in Chapters
7
and
8
).
Figure
4.5
shows the conceptual schema of such a TDW using the MultiDim
model. Dimension
Profile
collects demographic information (such as gender
and age group) of the car drivers. In the spatial dimension,
Cell
represents the
smallest unit we consider (i.e., a rectangle belonging to a grid that partitions the
spatial domain). Further, a cell belongs to one district (this is obviously a simpli-
fying approximation) and a district belongs to one zone. The
Time
dimension is
analogous to the one in Figure
4.3
, and the fact relationship
AggTrajectories
is related twice to this dimension, as illustrated by the roles
startTime
and
endTime
. Finally, each instance of the fact relationship contains aggregated
measures about the trajectories of a given profile that cross a spatio-temporal
cell. These measures are as follows:
presence
: the number of
distinct
trajectories.
distance
: the average distance of the trajectories.
sumDistance
: total distance covered by the trajectories.
duration
: the average duration of the trajectories.