Information Technology Reference
In-Depth Information
Classification :
Bayes
Estimated with 4 hidden neurons
1
0.5
0
-15
-10
-5
0
5
10
(a)
Classification :
Bayes
Estimated with 5 hidden neurons
1
0.5
0
-15
-10
-5
0
5
10
(b)
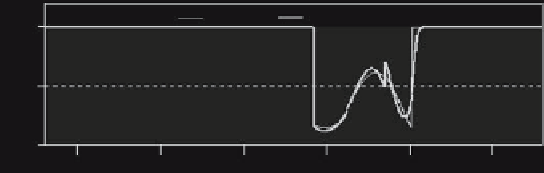
Classification :
Bayes
Estimated with 6 hidden neurons
1
0.5
0
-15
-10
-5
0
5
10
(c)
Fig. 1.28.
Estimation of posterior probabilities of class
A
with three classifiers:
(
a
) 4 hidden neurons (too low complexity), (
b
) 5 hidden neurons (performance very
close to the best achievable correct classification rate, (
c
) 6 hidden neurons (strong
overfitting)
find a classifier whose classification error rates are of the same order of mag-
nitude, and as small as possible, on the training set and on an independent
validation set. Figure 1.28 shows an example of overfitting in the estimation of
the posterior probability of class
A
in the example shown on Fig. 1.23; clearly,
the network with 4 hidden neurons is not complex enough for representing the
posterior probability, whereas a neural network with 6 hidden neurons fits the
fluctuations of the densities of points of the training set. The neural network
with 5 hidden neurons has a misclassification rate of 30.3% (estimated on a
test set of several million points), while the minimum achievable error rate,
from Bayes classifier, is 30.1%. Therefore, neural networks are among the best
classifiers.

Search WWH ::

Custom Search