Information Technology Reference
In-Depth Information
2.5
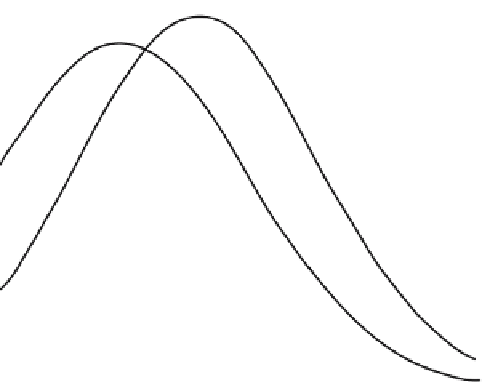
Men
2
1.5
1
Women
0.5
0
1.5
1.6
1.7
1.8
1.9
2
2.1
Height (m
)
Fig. 1.18.
Probability densities of heights of men and women for the population
under investigation
In view of the above results, it is natural to assign the person to class
W
,
which has the larger probability. This is an application of Bayes decision rule,
which will be explained below. The boundary between the classes thus defined
is shown on Fig. 1.19.
Because the prior probabilities are assumed to be equal, the discrimination
relies solely on the likelihoods.
Now assume that the person is not a member of the general population, but
is picked among the audience of a football match. Then the likelihoods of the
classes, given the height, are the same as above, but the prior probabilities are
different, since men are generally more numerous than women in the audience
of football matches; assume that the proportions are: 30% of women and 70%
of men. The posterior probabilities, as computed from Bayes formula, become
Pr(
W
1
.
60) = 61%. The results are very different
from the previous ones: the observed person is assigned to the class man if
Bayes rule is used as above; that important change results from the fact that
the likelihoods are not very different because the feature height is not very
discriminant, so that the classification relies heavily on the prior probabilities.
That result is illustrated by Fig. 1.20.
That simple example shows how to use Bayes formula for estimating pos-
terior probabilities, which are subsequently used for assigning each pattern to
a class through Bayes decision rule.
It is important to realize that, in practice, and in contrast with the above
examples, prior probabilities and probability densities are not known ana-
lytically, but are estimated from a finite set of observations
O
. Therefore,
|
1
.
60) = 39% and Pr(
M
|


Search WWH ::

Custom Search