Information Technology Reference
In-Depth Information
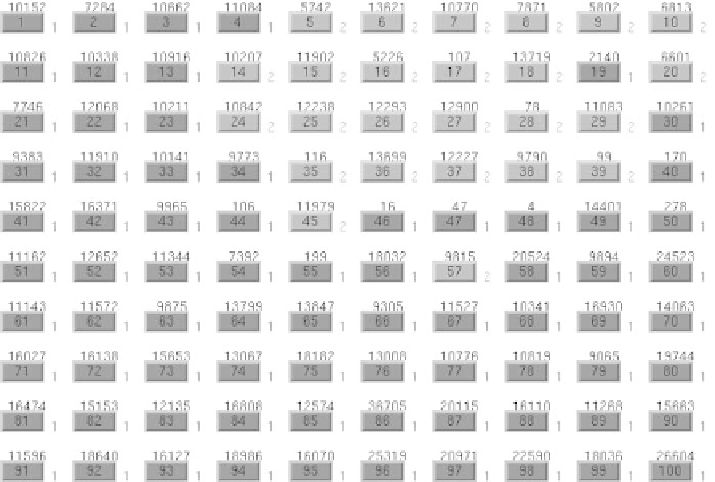
Fig. 7.29.
Presentation on the map of the two classes that are proposed by PRSOM
+ BUHC: PRSOM was determined from App
cod1
, and BUHC uses the Ward index.
The number at the right of the neuron frame represents the class that is obtained
through hierarchical classification. The set of dark grey neurons constitutes class 1
and the set of light grey neurons constitutes class 2
allows to compare the two classifications. The division between two geograph-
ical zones that is displayed on Fig. 7.30 shows a good adequacy to the division
that comes straight from the satellite data. It shows that the two classes have
been correctly demarcated by using PRSOM algorithm and then bottom-up
hierarchical classification onto the raw physical measurements without any
additional expert information. The nice consistency of hierarchical classifica-
tion results at the top level of the classification tree allows expecting that
clustering is consistent at any level of the hierarchy.
The second experiment is searching a zone that is already provided by
expert knowledge. Actually this class is case 2 water. This experiment confirms
the quality of vector quantization. In Fig. 7.22, this zone, which is endowed
with particular optical properties is colored in light grey. Investigation of
the various geographical zone that are associated to the 100 neurons of the
map enables to select three neurons. The subset of their associated spectra
allows to find a geographical zone that can be superimposed to the expert-
based region. Figure 7.31 shows the three patterns (w
33
,w
82
,w
93
) and the
associated geographical zones.
If the full hierarchy that arises from BUHC is investigated, one notices that
the three neurons of interest (namely 33, 82 and 93 constitute a subset that is
Search WWH ::

Custom Search