Information Technology Reference
In-Depth Information
Fig. 3.11.
Function
φ
8
Using those two functions, several bases of examples were generated by vary-
ing the number of examples from 100 to 1500 by steps of 100. The inputs were
uniformly distributed in [
1
,
1].
The model networks adopted are feedforward networks with one hidden
layer and a linear output neuron. For the bases generated by the first function
φ
8
, five model networks were proposed to NeMo with 4, 6, 8, 10 and 12 hidden
neurons respectively. For the bases generated by the second function
φ
12
(a
larger input space), six networks were tested, with 10, 14, 18, 22, 26 and 30
hidden neurons respectively.
−
Large Dimensions
It should be noted that the very low density of points in
12
; 1500 points in
R
12
mean that the average number of points per axis is smaller than two.
The actual error is obtained from 10
6
random selections using the same
input generation law (uniform distribution) and by computing the reduced av-
erage quadratic error EQM
r
between the measured output and the estimated
output.
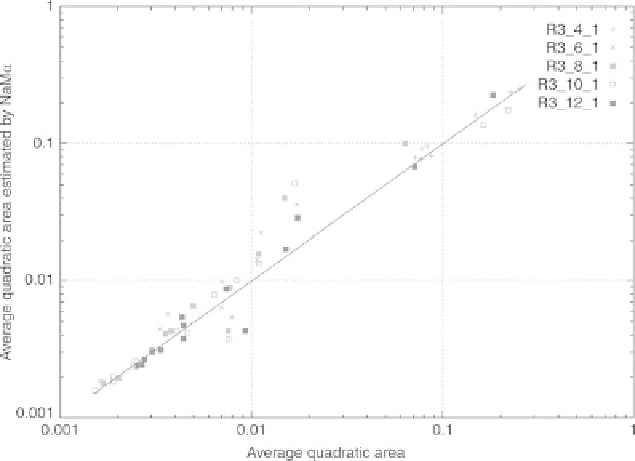
The figures below show (on a log-log scale) the true error EQM
r
(horizon-
tal axis)
vs.
the error estimated by NeMo (vertical axis). The points displayed
correspond to the different networks created from all bases of examples. Each
network was generated 15 times from databases with 100
,
200
,...,
1500 ex-
amples respectively.
R
Search WWH ::

Custom Search