Information Technology Reference
In-Depth Information
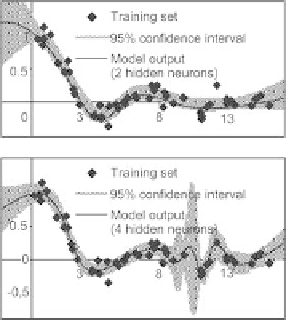
Fig. 2.26.
Model output and confidence intervals; model with 2 hidden neurons,
and model with four hidden neurons
When we defined the leverages, we showed that a model that is equally
influenced by all examples is unlikely to exhibit overfitting. In addition, we
showed that, in such a case, all leverages are equal to
q/N
. Therefore, for
models of different complexities having virtual leave-one-out scores of the same
order of magnitude, the model whose leverage distribution is most peaked
around
q/N
will be favored, except in cases where it is known from prior
knowledge that it is important that the model fit very accurately some specific
observations.
Figure 2.26 shows, for the example that was discussed previously, the pre-
dictions of the best models selected with 2 and 4 hidden neurons. The same
graphs display the 95% confidence intervals for the predictions of those models.
For the two hidden neuron model, the confidence interval is roughly constant
over the whole training domain, whereas, for the four-hidden neuron model,
the confidence interval is large in [8, 12]; the output of that model oscillates,
and it is not clear whether that oscillation is significant, or is just a con-
sequence of fitting the model to the local realization of noise. The leverage
distribution, shown on Fig. 2.27, reveals that the latter are more scattered for
the model with 4 hidden neurons (gray), than for the model with two hidden
neurons (black).
It is convenient to associate the quantity
µ
, defined as,
N
q
h
kk
,
N
1
N
µ
=
k
=1
to the leverage distribution. That quantity has the following properties:
•
It is always smaller than 1.
•
It is equal to 1 if and only if all leverages are equal to
q/N
.

Search WWH ::

Custom Search