Information Technology Reference
In-Depth Information
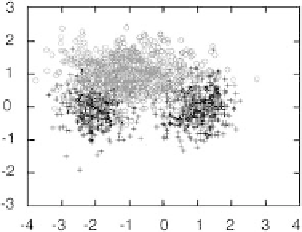
Fig. 2.8.
The examples of class A (
circles
) are realizations of a random variable
whose distribution is the product of two functions of
x
and
y
respectively; the
distribution along
x
is the sum of two Gaussians with centers
−
2and0respectively,
and standard deviation 0.5, and the distribution along
y
is a Gaussian centered at
0, with standard deviation 0.5. The examples of class B (
crosses
) are drawn from a
distribution that is the product of two Gaussian functions of
x
and
y
respectively; the
distribution along
x
is centered at -1, with standard deviation 1, and the distribution
along
y
is centered at 1, with standard deviation 0.5
be equal to 1 for all elements of one class (class A), and to 0 for all elements of
the other class (class B). After training, the output is an estimate of the prob-
ability of the unknown pattern belonging to class A. In the present problem,
feature space is of dimension 2, and the examples are drawn from overlapping
distributions, as shown on Fig. 2.8.
A classifier must provide a graded response in the zone of overlapping
between the classes, since the boundary between classes cannot be known
with certainty given the limited amount of data. In the present academic
example, the prior distributions are known, so that the posterior probability
of the classes can be computed from Bayes formula (see Fig. 2.9),
Fig. 2.9.
Posterior probability computed by Bayes formula

Search WWH ::

Custom Search