Information Technology Reference
In-Depth Information
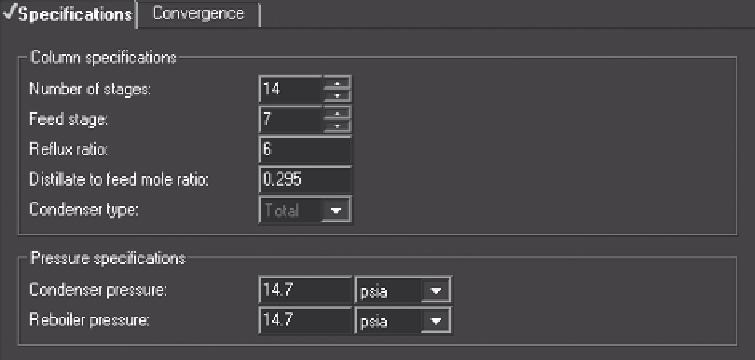
Figure 11.12
Distl primary input.
11.5 RIGOROUS MODELS
After developing a preliminary design, it should be possible to develop a rating model
of the system of interest. If the system is nearly ideal, or the phases can be represented
by an equation of state, the Aspen Plus database is probably suitable. If, on the other
hand, the system is sufficiently nonideal that an activity coefficient equation is required,
it is advisable to assess the equilibrium data within Aspen Plus by comparing them with
experimental data. If the data do not compare favorably, fit suitable data to an activity
coefficient model. If the Aspen Plus database is lacking, acquire suitable equilibrium
data either by searching the literature. developing data experimentally, or estimating
data using Unifac. Once suitable data have been found, they should be fit to an activity
coefficient model.
As an example, the vapor-liquid equilibrium data of Wilson and Simons' (1952)
for the isopropanol-water system at 95 mmHg is to be considered for a distillation
application. The experimental data were compared against results calculated using a
property analysis run “points along a flash curve” using Aspen Plus's stored data fit
with the Wilson equation. Figure 11.13 shows a plot of both data sets.
The usefulness of Aspen Plus's stored data should be assessed by an engineer in
light of the precision required for the application. For example, If the application
required that the product composition not be in the region approaching the azeotrope,
the Aspen Plus data would suffice since the data calculated differ very little from the
experimental data. If however, the proposed column required that the product be near
the composition of the azeotrope, Figure 11.13 shows that the azeotrope composition
calculated is about 0.05 mole fraction higher than the experimental value. This would
produce serious problems, for example, if this column were part of an azeotropic
distillation scheme involving two columns operating at different pressures. The quality
of the 95 mmHg data calculated from the stored Wilson parameters is suitable since
the data that were fit ranged between 77 and 212
◦
F, as can be seen from Figure 11.14,
and the experimental data range from a low of about 35
◦
C(95
◦
F) to a high of 49
◦
C
(120
◦
C), but unfortunately, do not accurately model the composition of the azeotrope.