Information Technology Reference
In-Depth Information
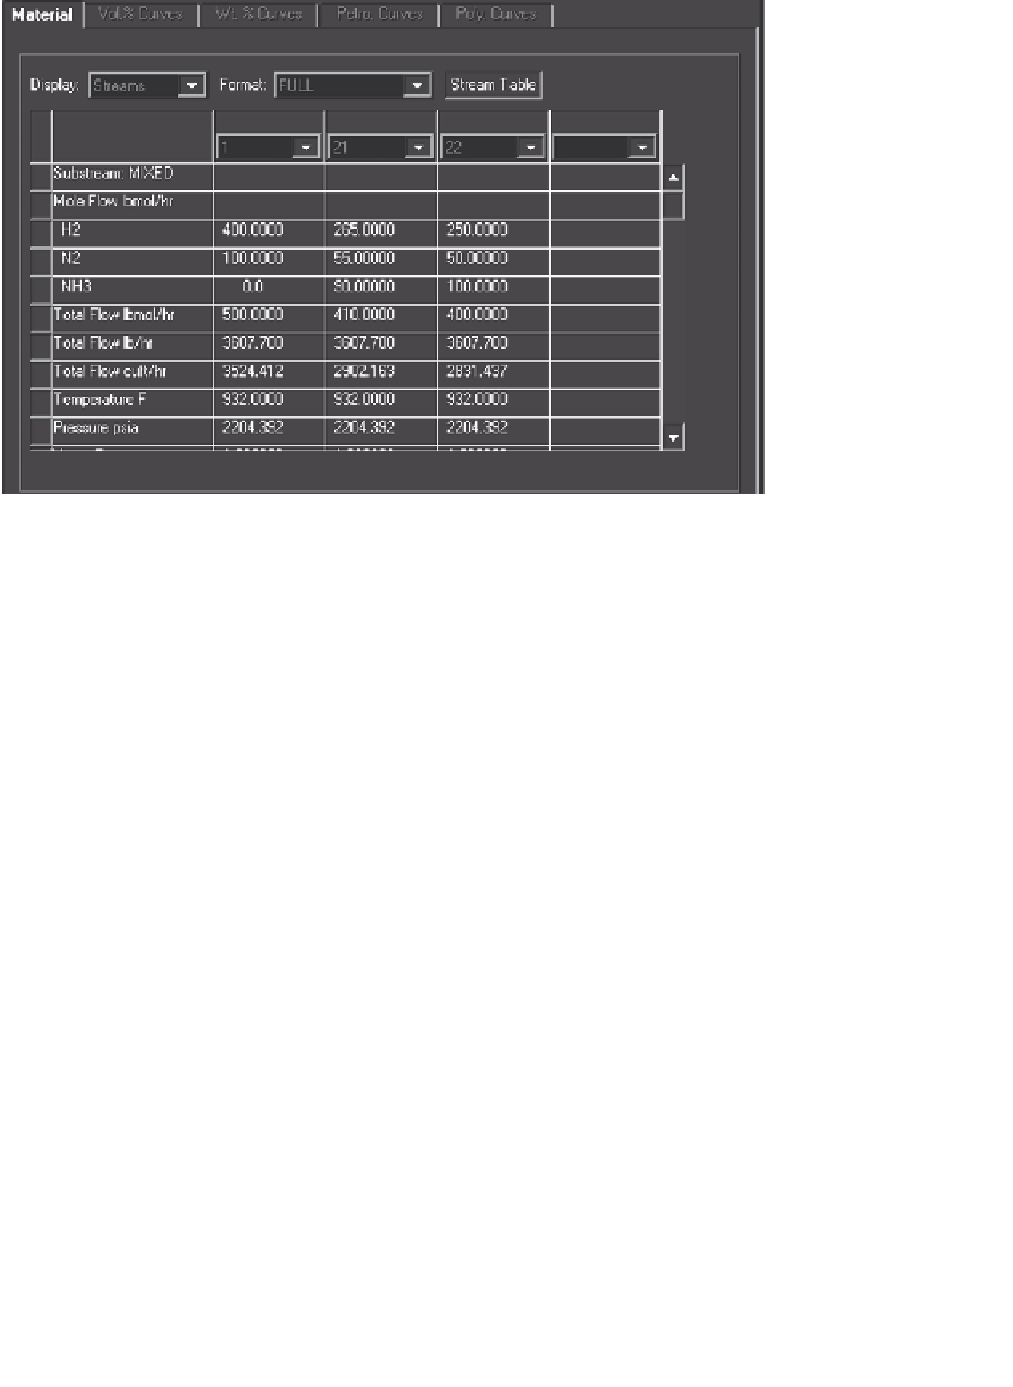
Figure 10.3
Comparison of extent and yield results.
Note that the shaded fraction conversion is 0.45 of N
2
, which is equivalent to 90
lbmol/hr of conversion. Aspen Plus does not provide this value. It was placed here for
the convenience of the reader. The results of the simulation are given in Figure 10.3,
where it may be observed that the fraction converted, 0.5 in ST2, results in 5 additional
lbmol/hr of N
2
converted relative to ST1. A value of 0.45 would produce results
identical to those of ST1.
10.2 RYield BLOCK
The RYield block is used when the distribution of products is known. No reaction
stoichiometry is involved. Two primary options are available: specification of compo-
nent yields and specification of component mapping. The other two options, a user
subroutine and petro specifications, are not considered here.
For the specification of component yields, the yield of each reaction product is spec-
ified as either moles or mass per unit mass of feed. A component may be specified as an
inert. The yields will then be based on a unit mass of noninert feed. Calculated yields
are normalized to maintain an overall material balance. Because of this, yield specifica-
tions are actually expressed as ratios of components in the product of the reactor. Yield
specifications result in a yield distribution rather than absolute yields. An example of
the use of the component yield option may be found at Examples/RYieldExample1.
This example involves the reaction of benzene and chlorine to form mono- and diben-
zyl chloride with hydrochloric acid as a by-product. In the absence of kinetic data
the ratio of products is specified as yields. The yields for this example are shown in
Figure 10.4. It should be noted that the multiplication of the yield data by a factor of 10