Environmental Engineering Reference
In-Depth Information
Dominant Position of Road Transport
Figure
3
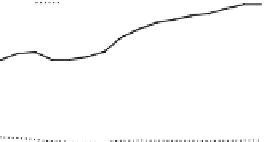
draws some conclusions about reasons of the modal share imbalance shown
in the previous section. First graph (Fig.
3a
) expresses growths of vehicles and
motorization index during the period 1990-2005, higher than 50%. In 2005, the
number of vehicles exceeded 25 million and the motorization index was higher than
600 vehicles per 1,000 inhabitants. In Fig.
3b
it is interesting to see, that average
mileage per vehicle remains constant and equal to 10,700 km/year, so increase of
total vehicle-kilometer is due to increase of private mobility using new passenger
vehicles. Average mileage per inhabitant has increased 76%, meaning more trips per
person and to larger distances. In the lapse of 15 years, there is a change from 3,851
km per inhabitant and year to 6,778 km, and resulting increases of energy consump-
tion and GHG emissions. A British study reveals that the fundamental cause of dis-
tance increase per inhabitant by car is the increase of the motorization index
[12]
.
As average consumption per vehicle is practically constant (Fig.
3c
), conse-
quently the consumption of energy per inhabitant is increasing parallel to vehicles
kilometer per inhabitant. Energy consumption per inhabitant changed from 20 GJ
in 1990 to 30 GJ in 2005. Although energy efficiencies of vehicles and fuels have
a
b
700
35
14000
600
30
12000
500
25
10000
400
20
8000
300
15
6000
200
10
4000
per 1.000 inhab.
fleet
100
5
per vehicle
per inhabitant
2000
average mileage
0
0
0
1990
1995
2000
2005
1990
1995
2000
2005
c
35
Energy per inhabitant
Energy per veh-km
30
25
20
15
10
5
0
1990
1995
2000
2005
Year
Fig. 3
Road transport trends in Spain: number of road vehicles per 1,000 inhabitants and total
number of vehicles (
a
), average vehicle mileage per vehicle and inhabitant (
b
) and average direct
energy consumption per inhabitant from road transport, and average fuel efficiency of road vehi-
cles (
c
)
[7, 11]