Environmental Engineering Reference
In-Depth Information
100%
Motorcycles
Mopeds
Buses
Heavy duty vehicles
Light duty vehicles
GPL passenger cars
Diesel passenger cars
Gasoline passenger car
80%
60%
40%
20%
0%
Vehicle fleet
Veic*km
VOC emissions
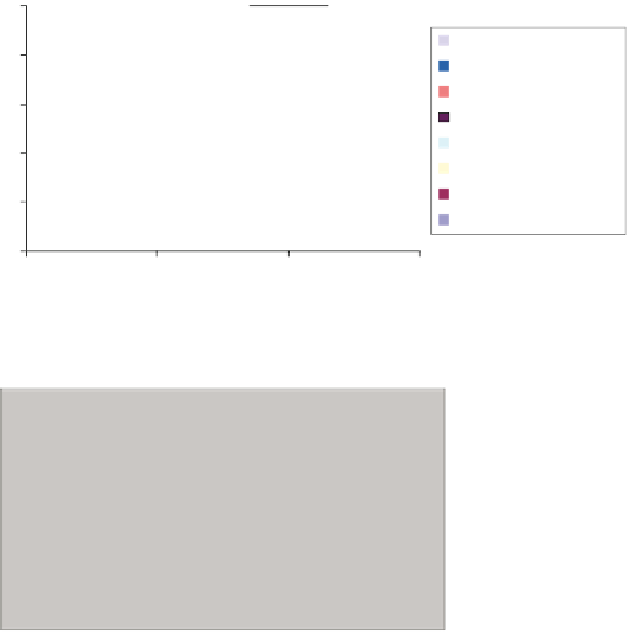
Fig. 5
Circulating vehicle fleet, average mileage estimates, and VOC emissions percentage
distribution for each vehicle category in Naples municipality
100%
Motorcycles
Mopeds
Buses
Heavy duty vehicles
Light duty vehicles
GPL passenger cars
Diesel passenger cars
Gasoline passenger car
80%
60%
40%
20%
0%
Vehicle fleet
Veic*km
PM10 emissions
Fig. 6
Circulating vehicle fleet, average mileage estimates, and PM
10
emissions percentage dis-
tribution for each vehicle category in Naples municipality
The repartition of PM10 emissions is illustrated in Fig.
1
, also considering the
share of PM emissions due to road pavement, tyres and brakes wear for each
vehicle class, that affect the total to about 22%. The major contribution to PM10
emissions from tailpipe, however, comes from diesel passenger cars, buses and
mopeds (Fig.
6
). It is observed that buses weigh upon PM10 emissions for 22%,
despite the fact that their percentage in the vehicle fleet is only 0.1% and their
average mileage per year does not exceed 1.5%. EURO 0 buses, devoid of modern
filtering particulate devices (installed on the latest vehicles), are characterized by
emission factors above 1.65 g/km.
Conclusion
The emission inventories from road transport are becoming more and more impor-
tant in order to accomplish the requirements of the European Directives concerning
air quality. In order to estimate the emissions from road transport in Naples municipality,