Environmental Engineering Reference
In-Depth Information
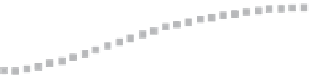
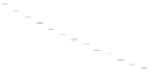
Emissions CO2 Car (2004 = 1)
Vehicles-Km (2004 = 1)
1,60
1,90
A0
B0
A1
B1
A2
B2
A3
B
3
Target
A0
B0
A1
B1
A2
B2
A3
B3
1,80
1,50
1,70
1,40
1,60
1,30
1,50
1,20
1,40
1,10
1,30
1,00
1,20
0,90
1,10
0,80
1,00
0,70
0,90
2004 2006 2008 2010 2012 2014 2016 2018 2020 2022 2024 2026 2028 2030
2004 2006 2008 2010 2012 2014 2016 2018 2020 2022 2024 2026 2028 2030
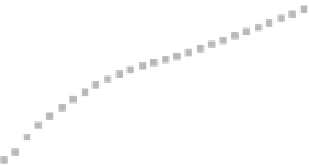
Emissions CO2 / veh-km (2004 = 1)
Modal Split (% car)
1,10
50%
A0
B0
A1
B1
A2
B2
A3
B3
1,05
48%
1,00
46%
0,95
44%
0,90
A0
B0
A1
B1
A2
B2
A3
B3
42%
0,85
40%
0,80
38%
0,75
36%
0,70
34%
0,65
32%
0,60
30%
2004 2006 2008 2010 2012 2014 2016 2018 2020 2022 2024 2026 2028 2030
2004 2006 2008 2010 2012 2014 2016 2018 2020 2022 2024 2026 2028 2030
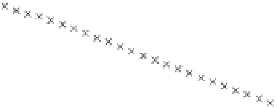
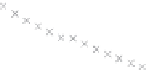
Emissions CO2 / Cap (2004 = 1)
Trip Length Car (2004 = 1)
1,20
1,25
A0
B0
A1
B1
A2
B2
A3
B3
1,10
1,20
1,00
1,15
A0
B0
A1
B1
A2
B2
A3
B3
0,90
1,10
0,80
1,05
0,70
1,00
0,60
0,95
2004 2006 2008 2010 2012 2014 2016 2018 2020 2022 2024 2026 2028 2030
2004 2006 2008 2010 2012 2014 2016 2018 2020 2022 2024 2026 2028 2030
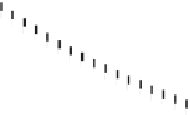
Fig. 3
CO
2
emissions and mobility behavior results from the case study
To determine transport's future contribution it was decided to use the average
contribution from transport to emissions in a carbon constrained context. In the
case of Spain, the projections to 2012 are that they will increase to 65% over 1990s
levels, on diffuse sectors (where transport is). For other sectors (energy and indus-
try) the forecast is just an increment of 37%. The diffuse sectors are responsible for
about 46-49% of the GHG emissions. Transport has a weight on the diffuse sectors
in the range from 42% on 1990 to 49% on 2004 (that means a 24% of total 2004
GHG)
[21]
. Taking into account that transport won't be able to follow the stabiliza-
tion curve that other sectors may do over the coming year, a more relaxing target
curve is propounded. However, it is necessary to mention that even the weakest of