Environmental Engineering Reference
In-Depth Information
a
June 2005
July 2005
Aug.05
June 2007
June 2007
Aug.07
3
3
2
2
1
1
0
0
1
23456789
1101112131415
b
2
0,10
1
0,05
`
0
0,00
1
23456789
1101112131415
c
4
4
3
3
2
2
1
1
0
0
123456789
1101112131415
Site
Site
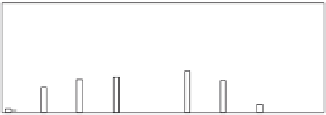
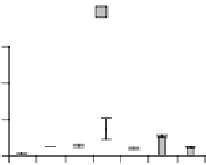
Fig. 3
Mean concentrations from 3-5 samples ± SE of Cl
−
(
a
), Na (
b
) and K (
c
) (%) in leaf
samples from the central part of Riga (spring, summer 2005, 2007). Sites: 1 - park; 2 - Hanzas 1;
3 - Hanzas 2; 4 - Elizabetes; 5 - Kr.Valdemara; 6 - Stabu 1; 7 -Stabu 2; 8 - Basteja 1; 9 -Basteja
2; 10 - Raina 1; 11 - Raina 2; 12 - Brivibas 1; 13 - Brivibas 2; 14 - Brivibas 3; 15 - Brivibas 4
Correlation coefficients and the level of statistical significance (p < 0.05) were
found using SPSS 14.0 version. The coefficients were classified as follows: r < 0.5
week, 0.5 < r < 0.8 medium close, and r > 0.8 close correlation.
Soil. The highest concentrations of Na and Cl
−
in soil samples of street greenery
were found at the end of March 2005 - beginning of spring. Levels exceeding 1,000
mg/kg Na were found at sites 2 (max. 1,568.1 mg/kg), 4 and 6, which exceeded the
background values by up to 51 times. A marked decrease in Na and especially Cl
−
concentrations occurred in spring and summer due to leaching from the root zone
by precipitation and uptake by the plants. Compared to Na, the Cl
−
concentrations
in 2005 and 2007 were considerably lower, ranging from 4.27 ± 0.08 mg/kg (Site 10)
(similar to park results) to 359.5 ± 194.2 mg/kg (Site 2) or on average more than
60 times higher than in the park.
The obtained concentrations of Cl
-
in street soil samples collected in June 2005 and
2007 on average were not significantly different, while results of Na were significant
higher in 2005 to compare with 2007. Such situation could be explained by the
winter season of 2006/2007, which was warmer in comparison to 2004/2005
[15]
.