Environmental Engineering Reference
In-Depth Information
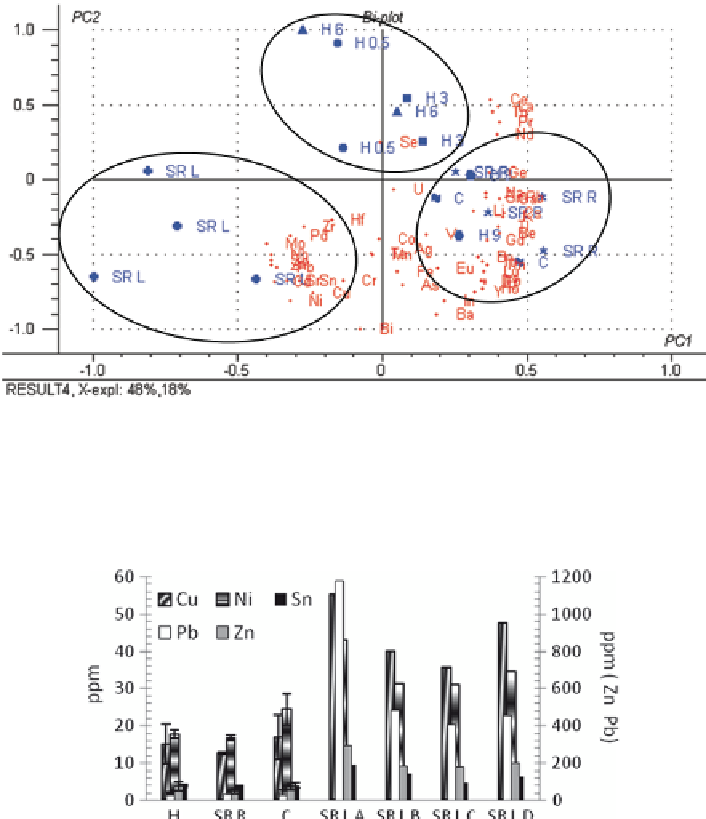
Fig. 3
Scores and loadings plot for the first two PCs resulting from the PCA of all elements
determined in roadside soils. C: control; SR L: west roadside of the secondary road; SR R: east
roadside of the secondary road; H 0.5, H 3, H 6 and H 9: highway soil samples at 0.5, 3, 6 and 9
m distance from highway
Fig. 4
Concentration of some TRE by sampling area. SR L A-SR L D: metal concentration in
soils from the west roadside of the secondary road. H, SR R and C: average value of metal con-
centration in highway, east roadside of the secondary road and control respectively
In fact, the concentration of these metals was considerably higher in these
soil samples as can be seen in Fig.
4
, where concentration of some of these
metals has been represented for samples from the west roadside of the secondary
road (SR L A-SR L D) against the average value of the concentrations in the
other sampling points (H: Highway; SR R: east roadside of the secondary road;
and C: control). The rest of above mentioned metals (data not shown) have the
same behavior.