Environmental Engineering Reference
In-Depth Information
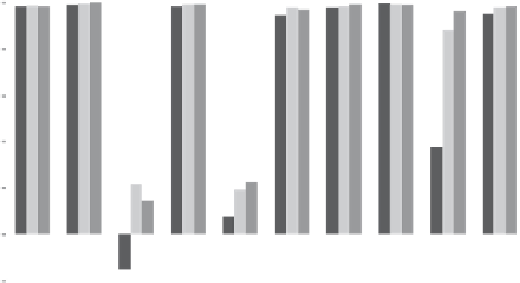
conc 1
conc 2
conc 3
100%
80%
60%
40%
20%
0%
Cd
Cr
Cs
Cu
Mo
Ni
Pb
Sn
V n
-20%
Fig. 2
Removal capacity of old furnace sludge at pH ~9 for metals in different concentrations in
real leachate spiked with multi metals and stirred in beakers (24 h)
Table 2
Sorption capacity for metals in solutions at different pH with high initial concentrations
and furnace sludge as sorbent
Sorption capacity mg/g
Furnace sludge
Old
Metals
C
0
mg/L
pH 5.6
pH 7.0
pH ~9
pH ~9
Maximum capacity
a
mg/g
Cu
21.6
1.7
4.1
4.1
4.3
16-24
Zn
21.8
-
4.0
3.8
4.1
4.2-9.7
Cr
4.4
0.59
1.0
0.97
1.0
9.6-16
Sn
3.8
0.76
0.96
0.66
0.75
-
Ni
5.0
0.062
0.82
1.0
1.0
-
V
4.1
0.78
0.29
1.1
1.0
-
Mo
4.7
0.31
-
0.25
0.23
-
Pb
0.84
0.14
0.19
-
0.20
64-80
Cd
0.46
0.013
0.086
0.094
0.090
6.7-10
Cs
0.45
-
-
0.018
0.014
-
a
Maximum capacity found at 20-80°C
[7]
- = No data
but only those for the concentrations used in this study. Initial concentrations of the
metals have been found to heavily affect the capacities in batch tests
[16, 17]
.
Higher capacities than presented here were found
[7]
, due to the much higher metal
concentrations used, up to 10 g/L. The capacity order was: Pb > > Cu > Cr > Cd >
Zn; following the order of the metals' electronegativity and hydrated ionic radii.
This order may also be explained by the metals' electron configuration and ligand
field stabilization energy (LSFE), as found by
[16]
.
The results of the batch tests, that is initial and final concentrations, were used
to calculate the Freundlich adsorption isotherms for each metal. The calculations
yielded the coefficients n and KF, and the regression coefficient R2, which show