Environmental Engineering Reference
In-Depth Information
PM10 (µg/m
3
)
UFP (particles/cm
3
)
140000
Busy Traffic on N18
120000
90
Construction site 1
Construction site 2
100000
80
70
80000
60
60000
50
40000
40
20000
30
0
7:29
7:31
7:34
7:37
7:40
7:43
7:46
Time (CET)
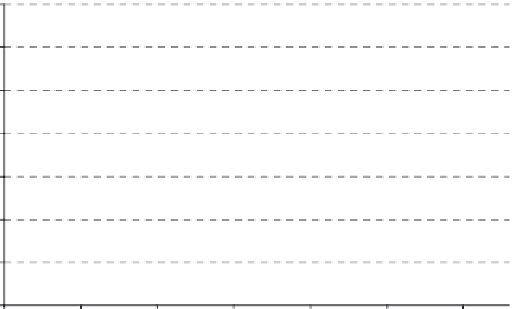
Fig. 3
Patterns of PM10 and UFP are related to different sources
500
7
450
6
P1
P2
Ratio
P1/P2
Direction
South
400
5
North
North
South
North
South
350
4
300
3
250
2
200
1
150
0
100
-1
50
-2
0
-3
7:40:48 :55:12
8:09:36 :24:00
8:38:24 :52:48
9:07:12 :21:36
Time (CET)
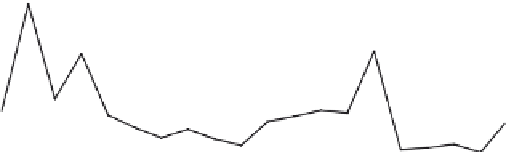
Fig. 4
Number of particles on the cycling track (P1 closest to the road, P2 1 m further away from
the road). Six trips on April 2, 2008
(~4%) between both instruments. It was therefore decided to repeat the test with
N = 10 which should allow us to determine the significance of the difference at the
p = 0.01 level.
The preliminary results were confirmed in the second test although average
particle numbers (~20,000 cm
−3
) were significantly lower than during the pilot test
(
t
-test p < 0.001). Some results are shown in Fig.
4
.