Graphics Programs Reference
In-Depth Information
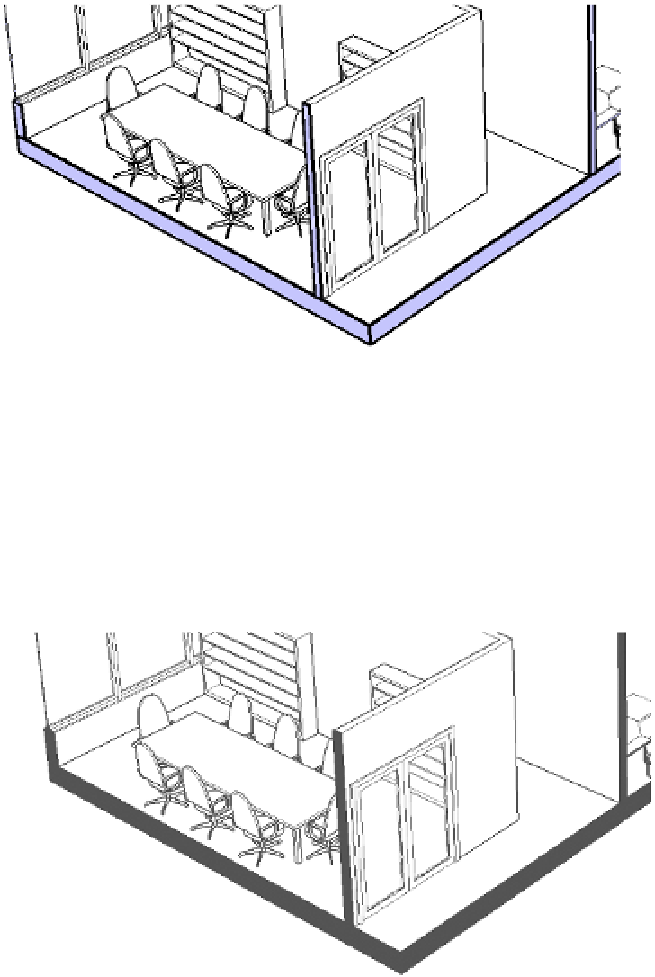
Figure 11.28
Regions between host
elements are shown as
discrete geometries.
You can use the Join Geometry option to clean up the lines between elements. But this
approach is time-consuming and often leads to other problems in your file when a lot of things
get “joined” just to create a graphic impression.
One simple way to clean this up graphically is to select a poché color that is the same as the
color of the lines between elements: black. Again, it's not the most desirable result, but it's fast,
doesn't require manual joining of geometry, and reads well (Figure 11.29).
Figure 11.29
Coarse poché material set
to solid black
Understanding analytic Visualization
Now that we have covered the basic view control tools, let's get back to the two types of
visualization: analytic and photo-realistic. To better understand the analytic concept, think for
a moment about Google Maps and how it uses two types of visualization—there's an option
to view both Map and Satellite modes. Think of the Map mode as your analytic view and the
Satellite mode as your photo-realistic view. Both views are important, depending on what you're
trying to communicate. If you're simply trying to understand directional information, the Map