Geology Reference
In-Depth Information
The power of cladistics is that it allows scientists to propose evolutionary relationships
between species. These proposals are hypotheses that can then be tested and put
through the rigors of the scientific method that I describe in Chapter 2.
The result of cladistic analysis is a chart illustrating the evolutionary relationship called
a
cladogram
or
phylogenetictree.
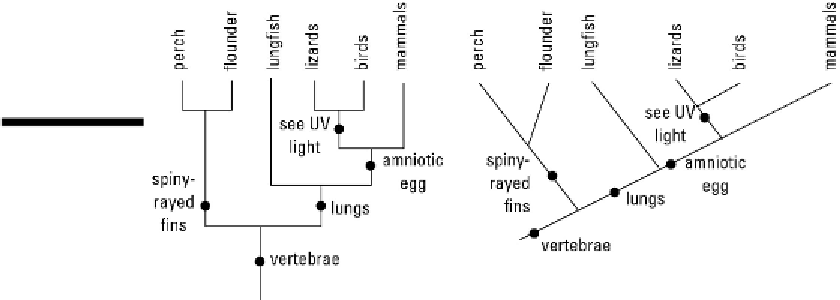
Two styles of phylogenetic trees are illustrated in Fig-
ure 17-2.
Figure 17-2:
Two
styles of clado-
grams, or phylo-
genetic trees.
These cladograms illustrate a simplified version of the evolutionary relationship
between some vertebrate animals (those with a backbone; see Chapter 19). Each split
branch indicates a new characteristic that makes the descendant groups different from
one another. For example, the first split indicates that ray-finned (or spiny) fish and lung-
fish shared a common ancestor. (I describe the evolution of fish in Chapter 19.) The des-
cendants of this ancestor are
either
spiny
or
have lungs.
Similarly, further up the tree, mammals and lungfish share an ancestor, but when the
characteristic of mammals known as
amniote eggs
appears, the two groups branch
apart. (I explain the importance of amniote eggs in Chapter 19.) The circles show you
where on the branches these characteristics separate one type of animal from its
closest relative. For example, mammals are more closely related to lungfish than they
are to other fish. Another example is that lizards and birds are more closely related to
each other than either of them is to mammals.
As you read the next chapters about earth's history and the evolution of organisms
through time, keep in mind that one of the reasons the fossil record is so important is
that it allows scientists to test the hypotheses they've created through the use of
cladistic analysis.