Database Reference
In-Depth Information
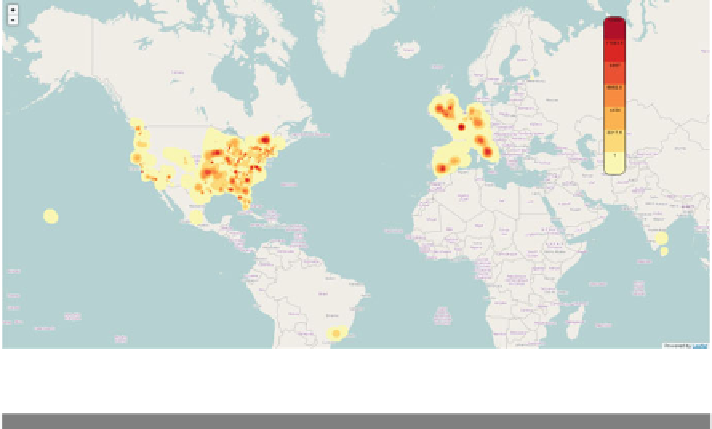
Fig. 5.10
An example of KDE heatmap on the map
Listing 5.9
Computing the KDE of the Tweet locations
kernelDensityEstimate: function(screenWidth, screenHeight, data,
bandwidth, kernelFunction, distanceFunction) {
// Step 1: Default to Epanechnikov kernel and Euclidean
distance
...
//matrices that hold the points at various stages in the
computation. Each will be the size of the screen (in pixels
).
var pointMatrix = kernel_density_object.makeZeros(
screenHeight, screenWidth, 0),
bandwidthMatrix = kernel_density_object.makeZeros(
screenHeight, screenWidth, 0),
kernelDensityMatrix = kernel_density_object.makeZeros(
screenHeight, screenWidth, 0),
maxPoint = 0;
// Step 2: Compute bandwidth matrix which stores the radius
required to find <bandwidth> points at each cell
for(var row = 0; row < screenHeight; row++){
for(var col = 0; col < screenWidth; col++){
...
//Step 3: kernel matrix is the result of bandwidthMatrix pushed
through the kernel function
for(var row = 0; row < screenHeight; row++){
for(var col = 0; col < screenWidth; col++){
...
//kernelDensityMatrix now holds a matrix of intensity values
for each point
return {
'estimate'
: kernelDensityMatrix,
'maxVal'
: maxPoint };
...
}
Source: TwitterDataAnalytics/js/kernelDE.js