Database Reference
In-Depth Information
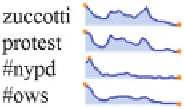
Fig. 5.7
An example of
small multiples using
sparklines to compare the
trend of different words and
hashtags
stdev+3
4
mean
stdev-3
count
3
stdev+3
2
1
0
mean
-1
count
-2
-3
Tue 15
stdev-3
03 AM
06 AM
09 AM
12 PM
03 PM
06 PM
09 PM
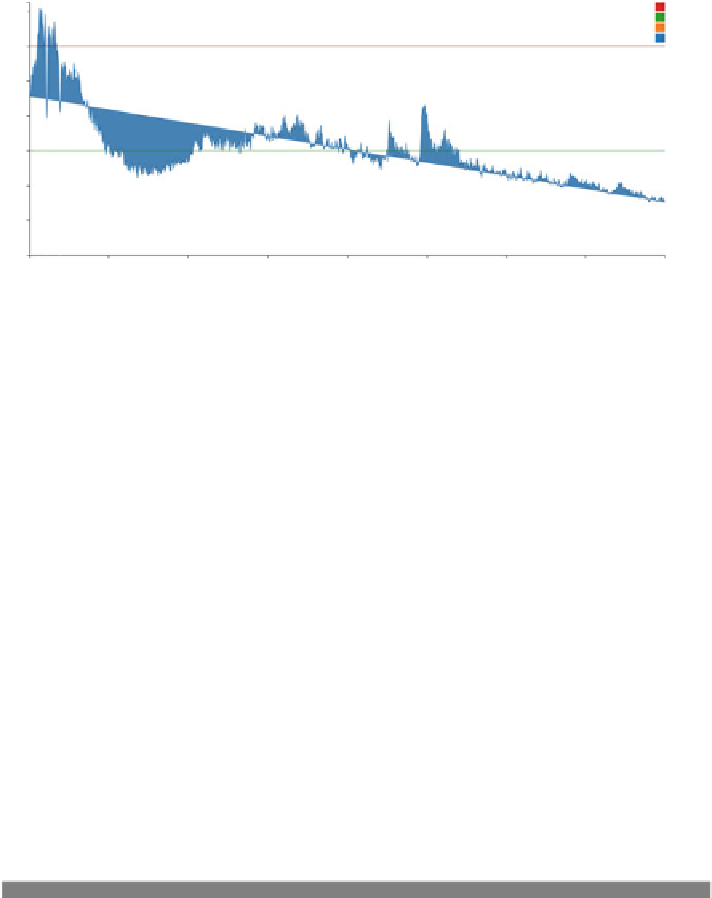
Fig. 5.8
An example of a control chart with the control line set to 3 standard deviations
Here, sparklines can be efficiently used to generate trending information of
multiple entities for quick analysis, as in Fig.
5.7
.
5.2.2.2
Control Charts
A control chart is a statistical tool used to detect abnormal variations in a process.
This task is performed by measuring the stability of the process through the use of
control limits. A control limit is a threshold which helps a user detect anomalous
periods of activity. If the data falls within the control limits, then the process is
considered stable. 3-standard deviations is typically chosen as the control limit.
If the activity falls outside the 3-standard deviations, then it is considered abnormal
and worthy of investigation.
As an example, let's look at Fig.
5.8
. Here, we present the volume of Tweets
generated every minute. Each value in the distribution is subtracted from the mean
and the difference is divided by the standard deviation to center as well as scale
the distribution using the methods in Listing
5.8
. Therefore, the distribution has
a mean 0 and a standard deviation of 1. The lower and upper control limit are
set to 3 standard deviations. On Twitter, this could be used to detect events by
Listing 5.8
Methods to calculate mean and standard deviation
public double GetStandardDev(ArrayList<DateInfo> dateinfos,
double mean) {
double intsum = 0;
int numperiods = dateinfos.size();