Database Reference
In-Depth Information
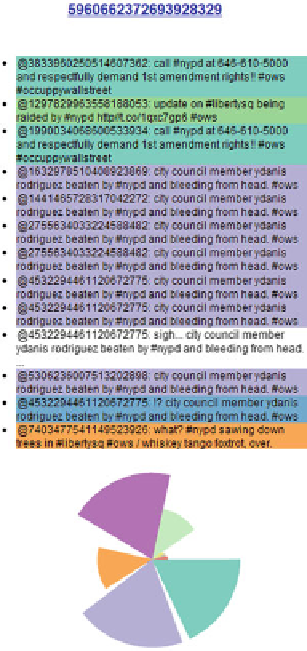
Fig. 5.3
Information panel
showing the Tweets from
most retweeted user
5.2
Visualizing Temporal Information
Time-series data is time sensitive information about a variable. Such variables in
the case of Twitter include the volume of Tweets and daily interactions between
users. Time-series are also referred to as trends. Visualizing trends helps us detect
temporal patterns in the data, such as the periodic activity of users, which can help
us understand their actions on Twitter.
Time-series visualization can be used to
Analyze information associated with time, and
Present a natural ordering of time-oriented information.
Time-series visualization is typically a chart with one axis (generally the
x-axis) representing time and the y-axis representing a measurement along another
dimension, such as the volume of Tweets. Figure
5.4
presents the natural rep-
resentation of the volume of Tweets collected per minute on Nov 15 in the
sample dataset. The information needed to generate this trend can be extracted