Travel Reference
In-Depth Information
Table 14.1.
Latvia: inbound tourism, 1997-2004.
1997
1998
1999
2000
2001
2002
2003
2004
Non-residents entering
Latvia ('000)
1824
1801
1718
1914
2039
2273
2470
3033
% change against the
previous year
6.5
-1.3
-4.6
11.4
6.5
11.5
8.7
22
Source:
Briksne, 2005a.
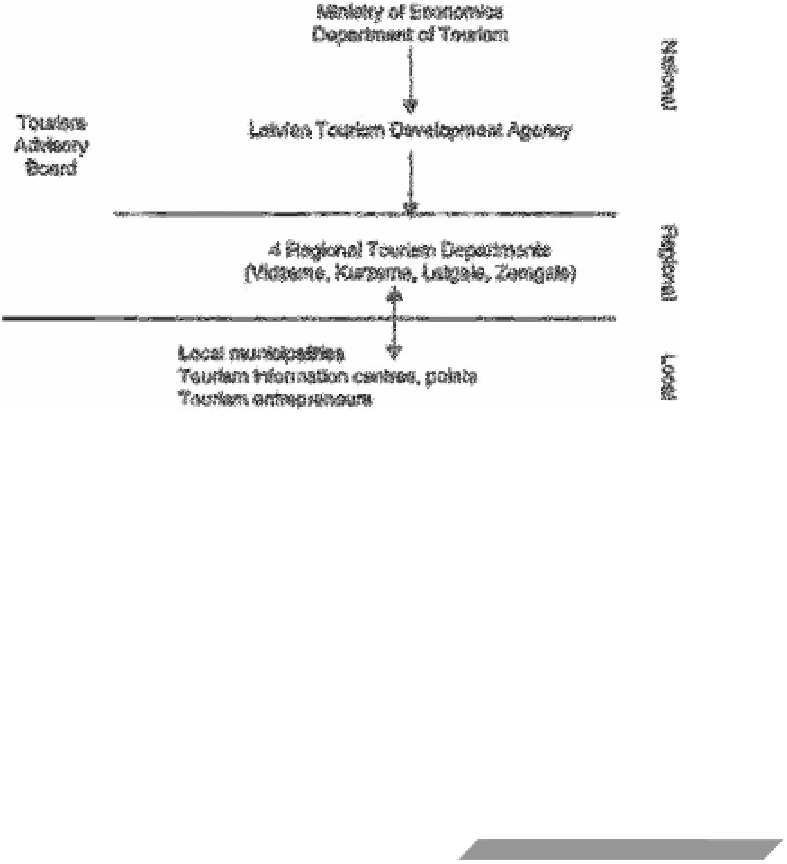
Fig. 14.1.
Latvia: institutional structure of tourism administration.
Regional Development and was not considered
a priority requiring serious investment. One of the
arguments for making tourism the responsibility
of the Ministry of Economics was commonality
with other EU countries. This ministry estab-
lished a Department of Tourism (
www.em.gov.lv)
employing eight professionals (see Fig. 14.1).
The main task of this department is the creation
of tourism policy, elaboration of legislative docu-
ments, and promotion of international coopera-
tion. The Latvian Tourism Development Agency
(LTDA), responsible to the Ministry of Econo-
mics (with 20 employees) is responsible for
implementation of tourism policy and marketing.
However, a high turnover of employees provides
a major problem for continuity, morale and
long-term development. None the less, in 2004
tourism received more than a doubling of its
budget (Fig. 14.2) to a figure of LVL1.1m, or
€
1.45m. This compares with Estonia's budget
of
€
1.7m and that of Lithuania of
€
669,000
(Lithuanian State Tourism Department, 2005).
1200
1041.60
1000
800
600
457.70
341.90
400
286.90
175.20
211.90
104.90
109.40
200
30.9
0
1996
1998
2000
Ye ar
2002
2004
Fig. 14.2.
National budget expenditure in
tourism in Latvia, 1996-2004. 1 LVL
0.72
(April 2005). The currency rate has rapidly
changed from 1996 to 2005 due to pegging of
Latvian Lats to the SDR currency basket.
Source: Ministry of Economics, 2004b.
=
?