Environmental Engineering Reference
In-Depth Information
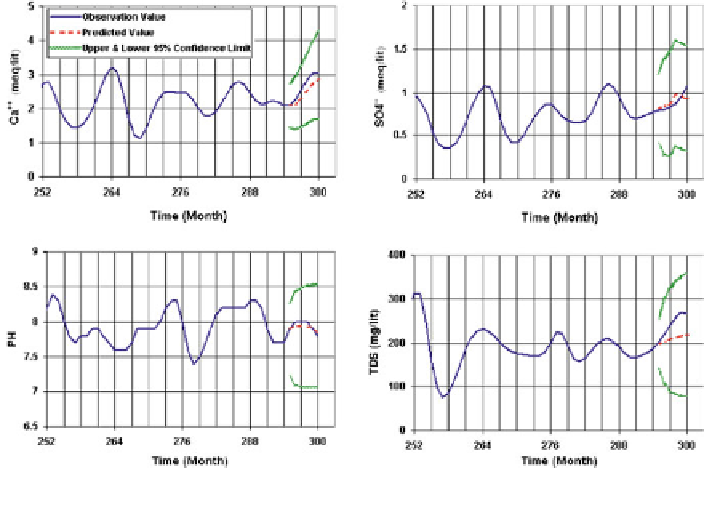
Fig. 4.5 Diagram of time series for each of water quality parameters and their predictions (the
predictions are based on 1 month ahead projections)
4.17.1.2 Selected Models of Few Water Quality Parameters in Zir-e-Pol
Station
Ca
++
As described in Fig.
4.5
the proper model for calcium (Ca
þþ
) was ARIMA.
(2,0,0)(0,0,0) The relation of the model is as follows:
Z
t
=2
:
186
þ
1
:
02Z
t
1
0
:
338Z
t
2
þ
a
t
ð
4
:
45
Þ
where Z
t
is the amount of calcium, and a
t
stands for error. The standard error is
0.331 according to comparison approaches. Akaike Information Criteria (AIC) and
Schwartz Bayesian Information Criteria are less than the other models. Also cor-
relation coef
cient is 0.95 which is proper.
p-Value is 0.99 which indicates that the model is excellent (Table
4.6
).
SO
4
--
Figure
4.5
shows variations of sulfate parameter and the best model for SO
4
is an
ARIMA (2,0,0) (1,0,0) S with seasonal components (Table
4.4
).
Search WWH ::

Custom Search