Environmental Engineering Reference
In-Depth Information
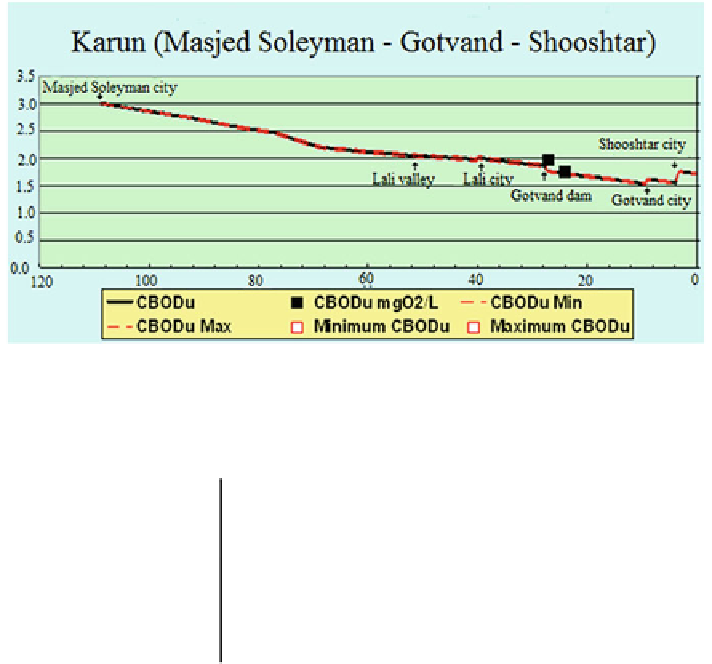
Fig. 6.15 BOD in the study area during normal conditions (mg/l)
Table 6.2 Dissolved oxygen level (mg/l) for aquatic life (mg/l); Quality Criteria for Water (
1986
)
(EPA 440/5-86-001)
Warm water conditions
Cold water conditions
Other stages
of life
Early stages
of life
Other stages
of life
Early stages
of life
30 day average
5.5
6.5
-
-
7 day average
6
(6.5) 9.5
-
-
Minimum 7 day average
4.0
-
5.0
-
1 day minimum
3.0
5.0
4.0
(5.5) 8.5
Studying the water quality of the river under critical conditions is then consid-
ered as the quality is not affected much during normal conditions. Figure
6.15
presents the changes in DO in low
low greatly
affects the Dissolved Oxygen variations due to incoming pollutants, and a lower
DO with greater variations is noticeable. Based on Table
6.2
aquatic life at early
and other stages of life is endangered in the cold season as DO falls to about 6 mg/l.
However, it passes Iran
low periods. The reduction in
s criteria for water quality compared to Table
6.3
.
Figure
6.16
illustrates BOD variations in the K
'
ā
r
ū
in River during low
ow
periods. BOD variations are also more considerable in low
low periods and the
changes due to receiving pollutants are much greater than in the normal
ow as
shown in Fig.
6.16
. Comparing the values to General Criteria for Water Quality in
Iran (Table
6.3
) and EPA Dissolved Oxygen Levels for Aquatic Life (Table
6.2
)
again proves the BOD is in agreement with the current standards and is not con-
sidered critical.
The daily freshwater discharge in the K
ā
ū
in River during 2005 was higher than in
many other years and may not be representative of the danger to
r
fish survival during


Search WWH ::

Custom Search