Environmental Engineering Reference
In-Depth Information
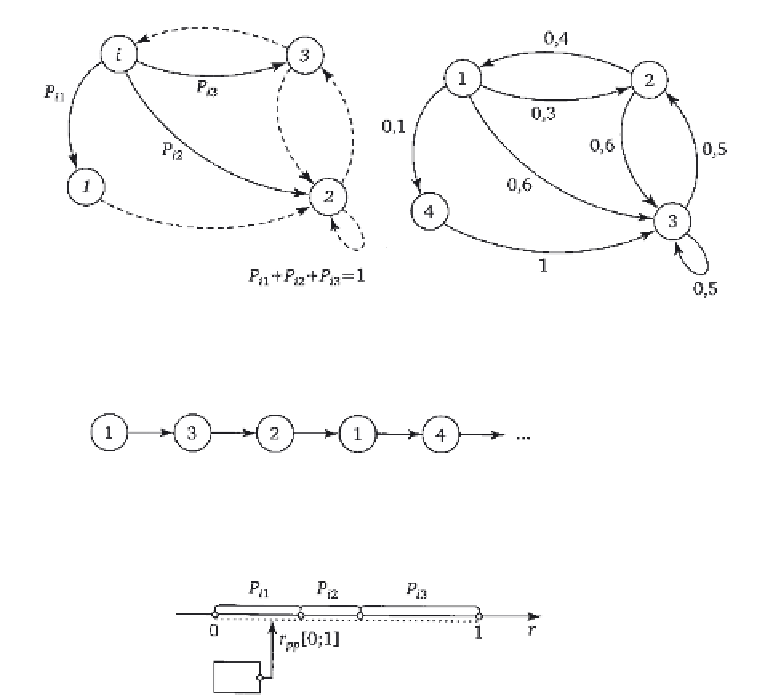
2.3
(left) Detail of the graph of transitions (transitions from the
i
-th
state form a complete group of random events).
2.4
(right) Example of a Markov transition graph.
2.5
Example of a Markov chain, simulated on the Markov graph
shown in Fig. 2.4.
RNG
2.6
The process of modelling the transition from the
i
i-th state of the
Markov chain to the
i
i-th state using a random number generator (RNG).
i
i-th state, it suffices to divide the interval [0; 1] into subintervals value P
i
1
,
P
i
2
,
P
i
3
, ... (
P
i
1
+
P
i
2
+
P
i
3
+ ... = 1), see Fig. 2.6. Then, using a random number
generator (RNG), it is necessary to determine the random number
r
pp
uniformly
distributed in the interval [0; 1] and determine which of the tanges it fits in.
After this the transition to the state defined by the RNG takes place and
this procedure is repeated for the new state. The result of this model is a
Markov chain (see Fig. 2.5).
Markov random processes with continuous time
So, again the model of a Markov process is described by a graph in which the
states (tips) are linked together by bonds (the transitions from the
i
-th to
j
-th
state), see Fig. 2.7.
Now, each transition is characterised by the probability density of transition
Search WWH ::

Custom Search