Environmental Engineering Reference
In-Depth Information
1. 12
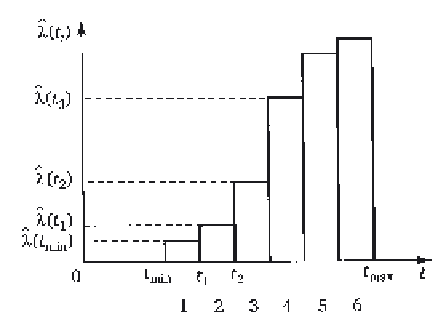
Estimate of failure rate.
The curves
f
(
t
) which have sharper tips than the normal curve have
E
> 0, and vice versa - flat-tipped curves
E
< 0 (Fig. 1.13b).
The selection of the distribution law consists of the selection of an
analytical function which best approximates the empirical reliability
function.
Selection is to a large extent an uncertain and largely subjective
procedure and much depends on apriori knowledge about the object and
its properties, operating conditions, as well as analysis of graphs
P
(
t
),
f
(
t
),
l
(
t
).
It is obvious that the choice of the distribution depends primarily on
the type of empirical p.d.f.
f
(
t
), as well as on the type of
l
(
t
). , the
choice of the distribution law has the nature of the process of adoption of
a hypothesis.
Suppose that for one reason or another, a hypothetical distribution law
given by theoretical p.d.f.is selected
f
(
t
)
= Ψ (
t, a
,
b
,
c...
)
.
where
a
,
b
,
c
, ... are unknown distribution parameters.
It is required to choose these parameters so that the function
f
(
t
)
smoothes out most efficient the stepped graph
f
(
t
). The following method
is used here: the parameters
a, b, c
, ... are selected so that several important
numerical characteristics of the theoretical distributions are equal to the
corresponding statistical estimates.
On the graph, the theoretical p.d.f.
f
(
t
) is plotted together with
f
(
t
) so that the results of approximation (differences between
f
(
t
) and
f
(
t
)) can be visually assessed. Because these differences are inevitable, the
question arises: are they explained by random circumstances associated
with the fact that the wrong theoretical distribution was chosen? The answer
to this question is the calculation of the goodness of fit criterion.
Calculation of the goodness of fit criterion
. The goodness of fit criterion
Search WWH ::

Custom Search