Environmental Engineering Reference
In-Depth Information
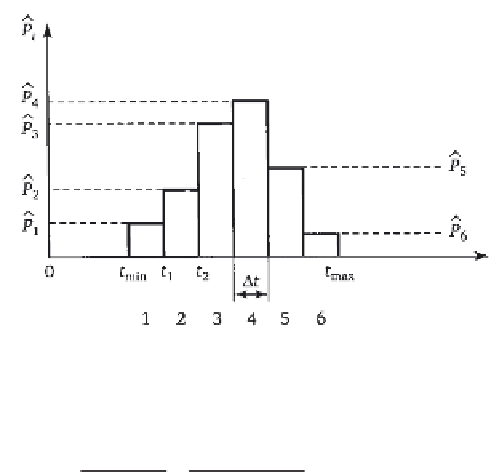
1. 9
Possible type of histogram of operating time to failure,
k
= 1 - 6.
- failure rate (estimate of FR)
D
nt t
(,
)
D
nt t
(,
)
ˆ
()
l=
t
=
.
i i
+
1
i i
+
1
[
]
i
Nt t
()
D −
N nt t
()
D
i
i
Figures 1.10-1.12 are the plots of statistical estimates
Q
(
t
).
The rules for constructing graphs are clear from the above calculation
formulas. Each of the graphs has its scale.
Calculation of statistical estimates of numerical characteristics.
The statistical estimates of numerical characteristics can be calculated
using the data of the generated statistical series.
Estimates of the characteristics are defined as follows:
-
estimate of mean operating time to failure
(
statistical mean operating
time
):
K
ˆ
=
∑
ˆ
ˆ
T
tP
;
0
ii
1
-
estimate of the dispersion of operating time to failure
(
empirical
dispersion of operating time
):
K
ˆ
ˆˆ
∑
ˆ
(
2
D tTP
=
);
−
i
0
i
1
where
= +D = −D
is the middle of the
i
i-th interval of operating
time, i.e. the mean operating time in the interval.
The estimate of dispersion
ˆ
t t
(
t
)/2
(
t
t
)/2
i
i
i
+
1
ˆ
ˆ
=
It is advisable to calculate the estimates and some subsidiary character-
istics of dispersion of the random variable
T
:
- sampling coefficient of asymmetry of operating time to failure
DS
2
.

Search WWH ::

Custom Search